
- Renewable Generation
- Ocean Energy
- Tidal & Wave
- Marine Engineering
Ocean, Tidal & Wave Power
Tidal Range | Tidal Stream | Wave | Ocean Current | OTEC | Salinity Gradient
Predictable power from the moving sea.
The oceans hold energy in tides, waves, currents, temperature differences and salinity. Tidal power is predictable years ahead; wave and thermal resources are large but harder to harvest. BARREL supports ocean energy projects from resource studies and technology screening through marine surveys, approvals, moorings, subsea cables and installation to operation in one of the harshest environments in engineering.
TTides
Rise and fall and the currents they drive
WWaves
Wind energy carried across the ocean
SSurvival
Machines that last in storms and salt
- Largest tidal barrages
- 240–254 MW
- Tidal range, Gulf of Khambhat
- Up to ~11 m
- Good tidal stream speed
- 2–3 m/s
- Wave power per metre of crest
- 5–70 kW/m
- OTEC temperature difference
- ~20 °C
Section 01
Ocean Energy — Overview
Ocean energy covers several distinct resources. Tides come from the gravity of the Moon and Sun and are known years in advance; waves carry wind energy across whole ocean basins; currents, temperature layers and salinity differences add further, less tapped sources.
Tidal barrages have run for decades and tidal stream arrays have proven their turbines at sea. Wave energy, OTEC and salinity gradient are still at the demonstration stage, with costs above those of offshore wind today.
1.1Forms and maturity
| Form | Source | Maturity |
|---|---|---|
| Tidal range | Height difference between high and low tide | Commercial: La Rance (France, 240 MW, 1966), Sihwa Lake (Korea, 254 MW) |
| Tidal stream | Fast tidal currents in straits and channels | Early commercial arrays, for example in Scotland |
| Wave energy | Motion of surface waves | Demonstration and pilot farms |
| Ocean current | Steady large-scale currents | Prototype and research |
| OTEC | Warm surface and cold deep water | Pilot plants of up to about 1 MW scale |
| Salinity gradient | Mixing of fresh and sea water | Laboratory and small pilots |
1.2Why ocean energy
01
Predictable
Tides can be forecast decades ahead, which suits grid planning better than most renewables.
02
Dense resource
Water is about 800 times denser than air, so tidal turbines are compact for their output.
03
Complements wind and sun
Tidal peaks follow the lunar cycle and wave power lags the wind, smoothing a renewable mix.
04
Low visual impact
Most stream and wave devices sit at or below the surface, far from view.
05
Islands and coasts
Can supply islands and coastal towns that rely on diesel.
06
Blue economy
Builds port, shipyard and marine-service skills that also serve offshore wind.
Section 02
Tidal Range and Tidal Stream Power
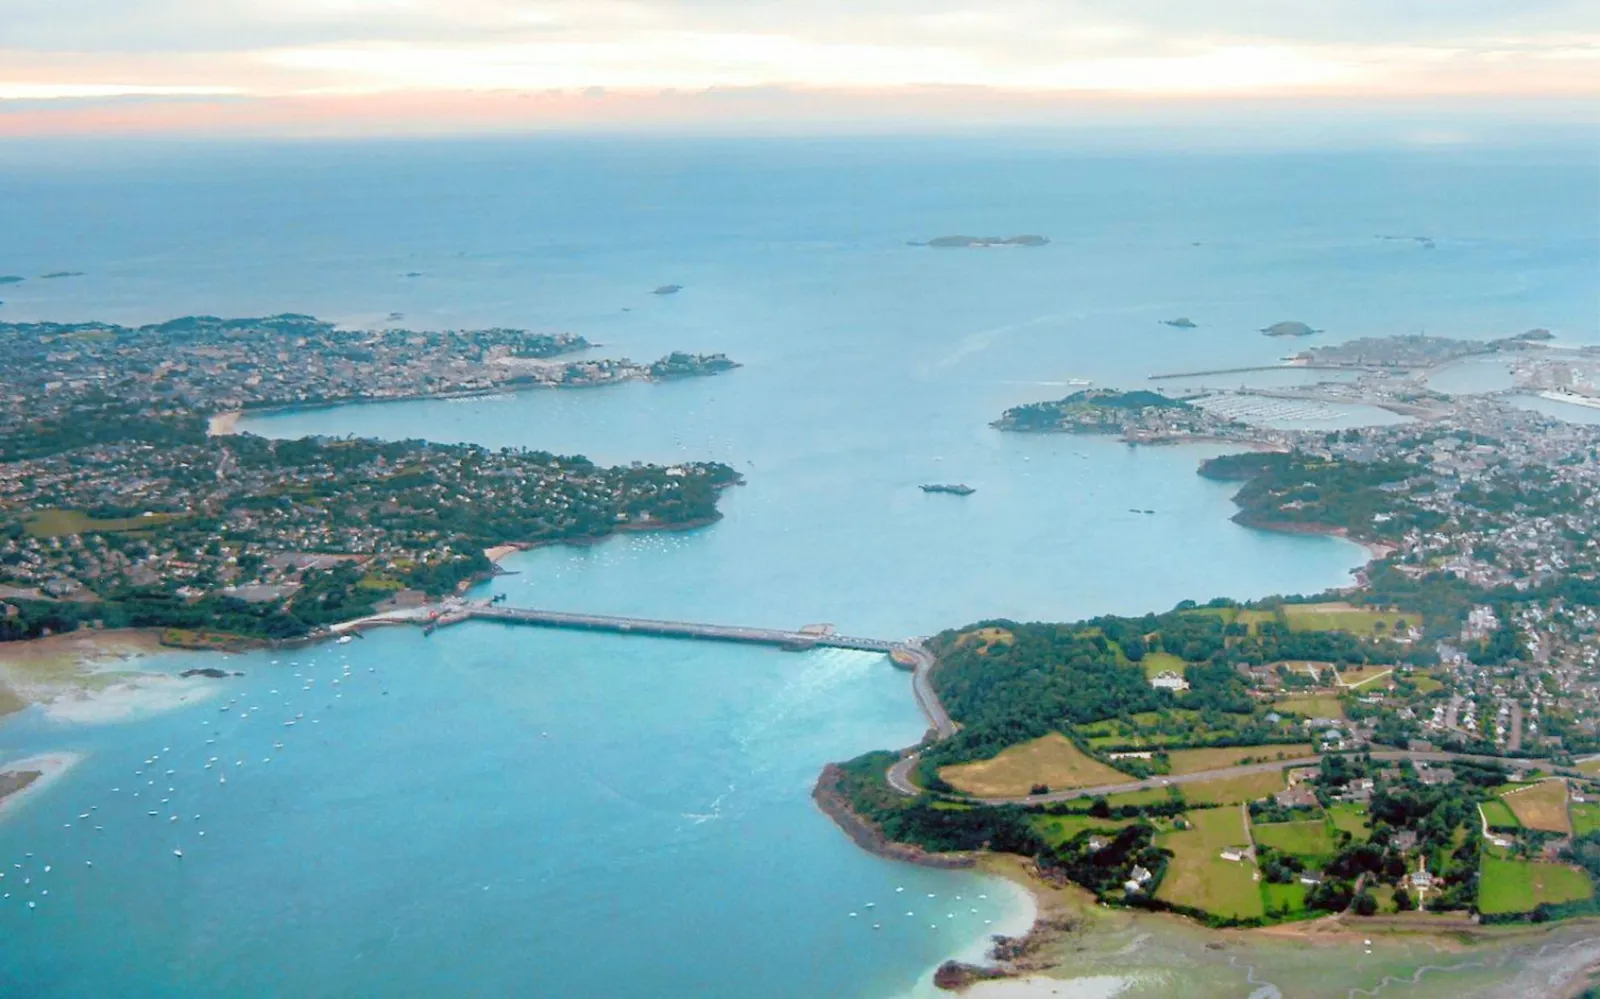
Tidal range schemes hold water behind a barrage or lagoon wall and release it through low-head turbines, much like a low-head hydro plant. They need large tidal ranges, usually above about 5 m.
Tidal stream schemes place turbines directly in fast currents, like underwater wind turbines, with no dam at all.
01
RangeTidal barrage
A dam across an estuary with bulb turbines and sluices; generates on the ebb, the flood or both.
02
RangeTidal lagoon
An enclosed wall in open water or along the shore, avoiding the closure of a whole estuary.
03
StreamHorizontal-axis stream turbine
Two or three-bladed rotors on a seabed frame or monopile, the most proven stream design.
04
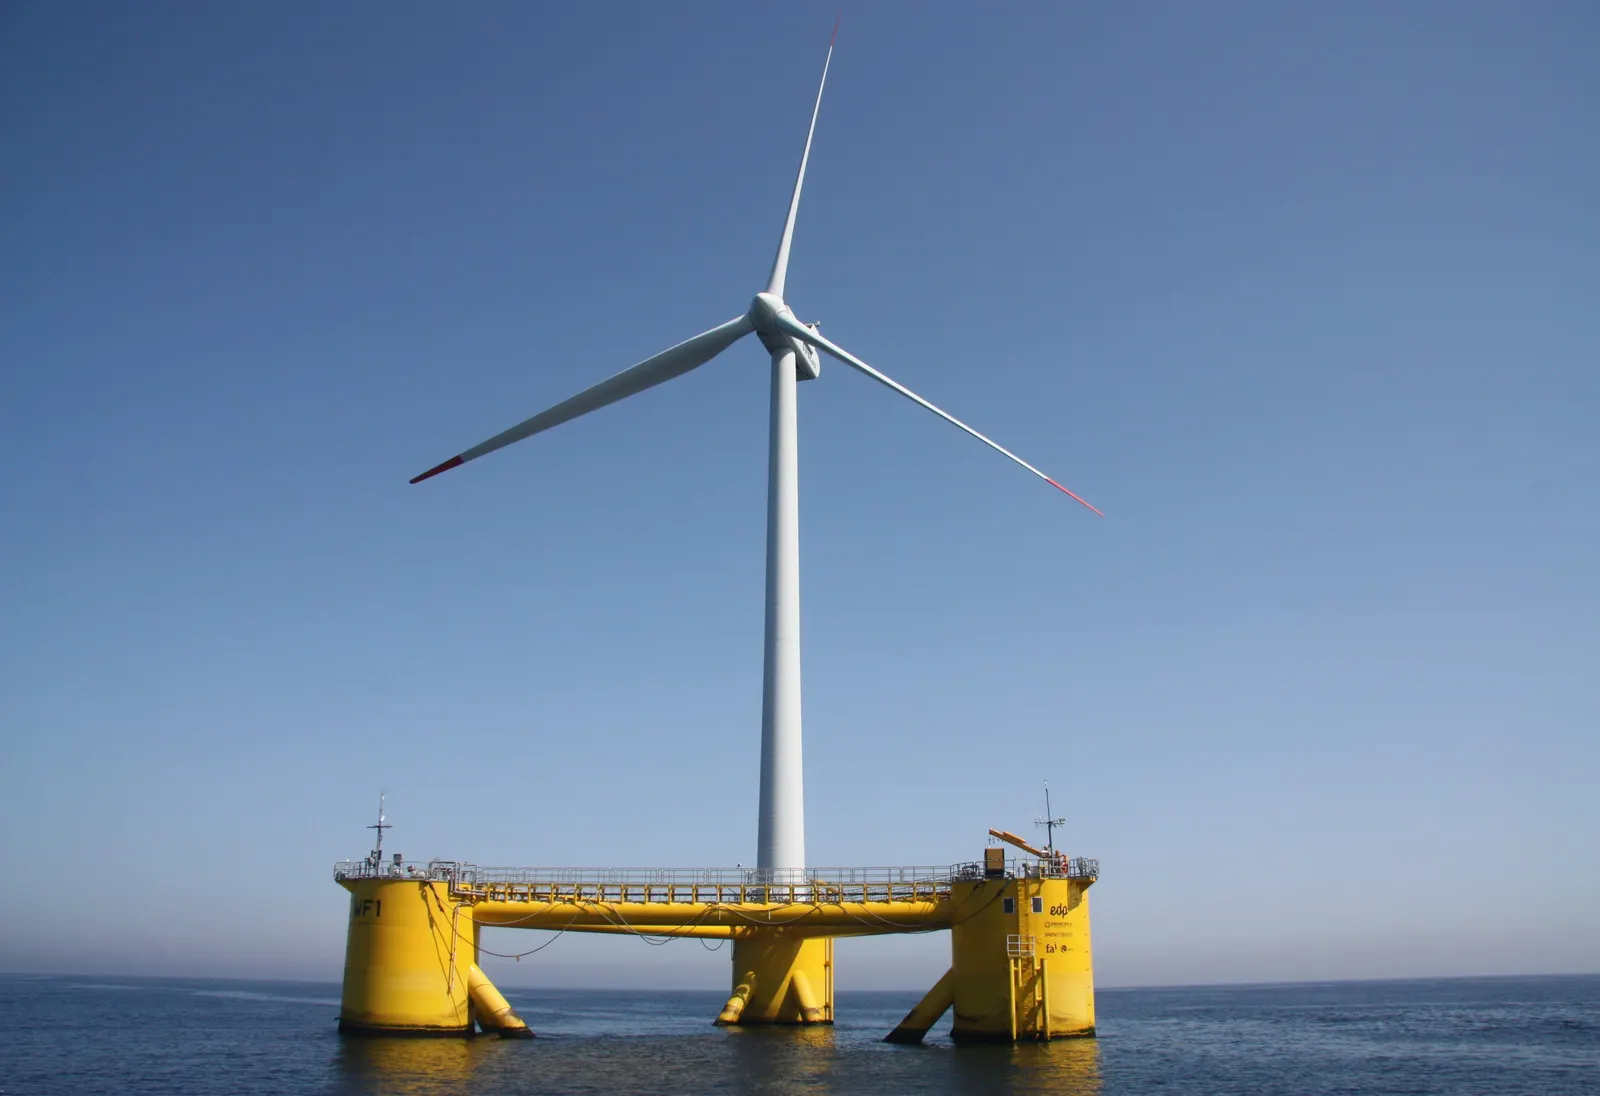
StreamFloating stream platform
Turbines hung below a moored floating hull, easier to reach for maintenance.
2.1Power of a tidal stream turbine
Rotor output
P = ½ × ρ × A × v³ × Cp
Example (indicative): 18 m rotor (A ≈ 254 m²) at 2.5 m/s, Cp = 0.4 → about 0.8 MW
Power rises with the cube of current speed, so a site with currents 20 % faster gives about 70 % more power. Annual energy follows from the speed distribution over the spring-neap cycle.
| Symbol | Meaning |
|---|---|
| ρ | Sea water density, about 1,025 kg/m³ |
| A | Swept area of the rotor, m² |
| v | Current speed, m/s |
| Cp | Power coefficient, about 0.35–0.45 in practice |
Section 03
Wave Energy Converters
Many device types have been tried because waves move in several ways at once. No single design has yet become standard, and survival in storms is the main test of each.
01
OWCOscillating water column
Waves push air in and out of a chamber through a bidirectional air turbine; can be built into breakwaters.
02
BuoyPoint absorber
A floating buoy moves against a fixed or slower reference and drives a hydraulic or direct-drive power take-off.
03
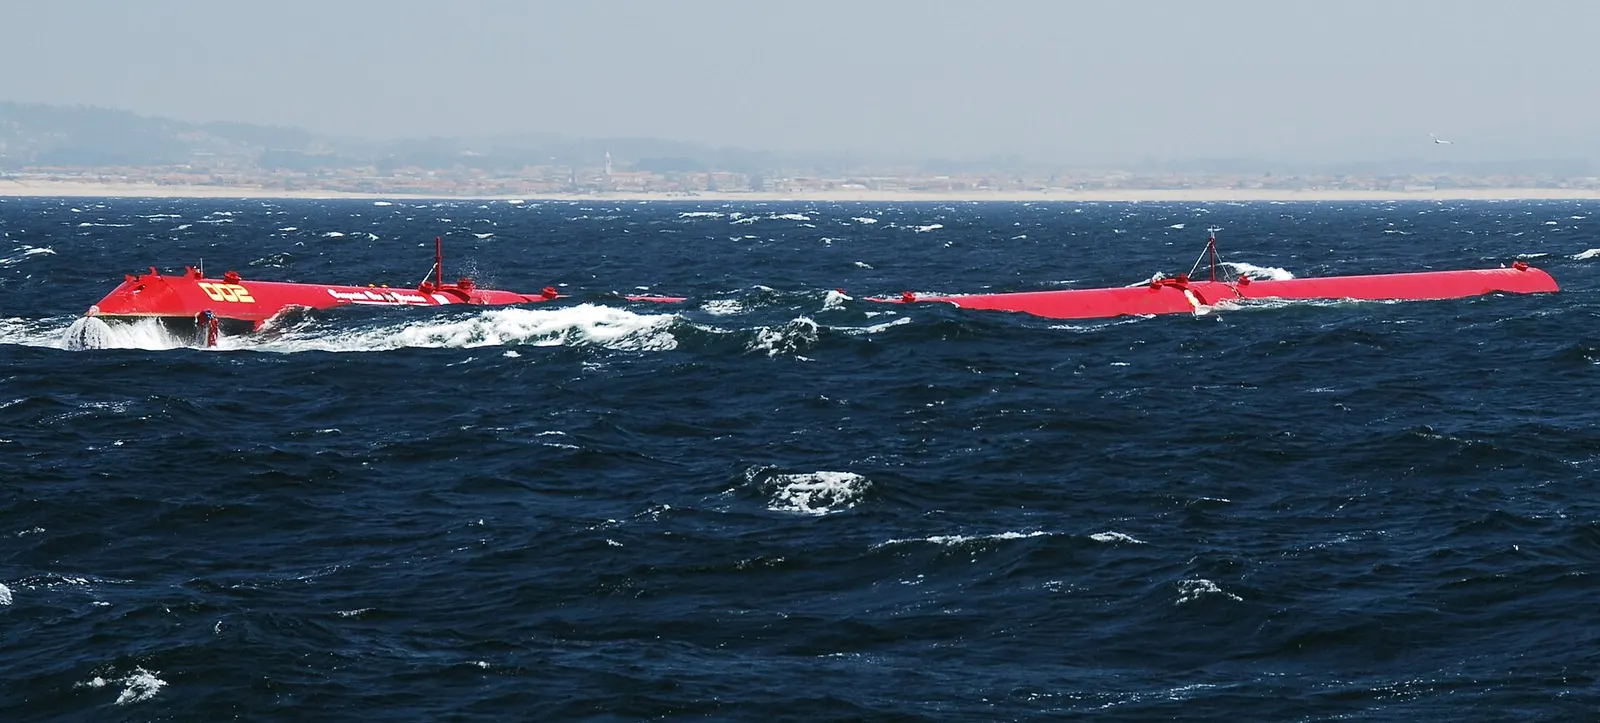
LineAttenuator
Long jointed floating sections lie along the wave direction; flexing at the joints drives the power take-off.
04
NearshoreOscillating surge converter
A hinged flap on the seabed swings back and forth with the surge of waves in shallow water.
05
ReservoirOvertopping device
Waves spill into a raised basin and the water returns to sea through low-head turbines.
06
SeabedSubmerged pressure differential
Pressure changes under passing waves move a submerged membrane or body.
3.1Power in deep-water waves
Wave power per metre of crest
P = ρ × g² × H² × T / (64π)
Approx. P (kW/m) ≈ 0.49 × Hs² × Te; for Hs = 2 m and Te = 8 s, about 16 kW/m (indicative)
Wave power grows with the square of wave height. Exposed Atlantic coasts average 40–70 kW/m; Indian coasts are typically lower and strongly seasonal, peaking in the south-west monsoon.
| Symbol | Meaning |
|---|---|
| ρ | Sea water density, about 1,025 kg/m³ |
| g | Gravity, 9.81 m/s² |
| H | Significant wave height Hs, m |
| T | Energy period Te, s |
Section 04
Ocean Current, OTEC and Salinity Gradient
These resources are vast in theory but are still being proven. They suit specific places: steady current corridors, tropical waters over deep sea, and river mouths.
Ocean current
4- Steady currents such as major western boundary currents
- Moored or tethered underwater turbines
- Deep-water anchoring and long cables
- Prototype stage
OTEC
4- Needs about 20 °C between surface and water at about 1,000 m
- Closed cycle with ammonia, or open cycle with flash steam
- Large cold-water pipe is the key challenge
- By-products: desalinated water, cooling, aquaculture
Salinity gradient
4- Pressure-retarded osmosis
- Reverse electrodialysis
- Membrane cost and fouling limit progress
- Sites at river mouths and salt lakes
Tropical islands such as Lakshadweep and the Andaman and Nicobar Islands have the warm surface and deep cold water OTEC needs close to shore; low-temperature thermal desalination using the same principle has supplied drinking water there.
Section 05
Resource Assessment and India's Sites
Every ocean project starts with long measurement campaigns: tide gauges and current profilers for tidal sites, wave buoys and hindcast models for wave sites, and bathymetry and seabed surveys for both.
Studies commissioned for India have estimated theoretical potentials of the order of 12 GW for tidal and 40 GW for wave power (indicative). Practical potential is much smaller once depth, seabed, shipping, environment and grid access are considered.
5.1India's studied sites (potential, not built)
| Area | Resource | Notes (general) |
|---|---|---|
| Gulf of Khambhat | Tidal range up to about 11 m | Large studied tidal range potential; heavy sediment and wide mudflats |
| Gulf of Kutch | Tidal range up to about 8 m | Tidal schemes proposed in the past, not taken forward on cost |
| Sundarbans, West Bengal | Tidal range and creek currents | Small tidal project studied and later dropped; sensitive mangrove ecology |
| Southern and western coasts | Wave energy | Moderate, monsoon-driven wave climate; breakwater OWC tested in Kerala |
| Lakshadweep, Andaman and Nicobar | OTEC | Deep water close to shore; thermal desalination demonstrated |
5.2Measurements and studies
Metocean
4- Tide gauges and ADCP current profiles over months
- Directional wave buoys
- Hindcast and numerical models
- Extreme waves and storm surge for design
Site
4- Multibeam bathymetry and side-scan sonar
- Geophysical and geotechnical seabed surveys
- Shipping, fishing and protected areas mapping
- Landfall and grid connection route
The National Institute of Ocean Technology (NIOT) under the Ministry of Earth Sciences has worked for decades on wave energy, ocean thermal energy and thermal desalination, including a breakwater wave plant and island desalination plants.
Section 06
Marine Environment, Moorings and Survivability
The sea is the hardest place to run machinery. Devices must survive extreme storms, resist corrosion and fouling, and be installed and serviced in short weather windows.
| Issue | Design response |
|---|---|
| Extreme waves and currents | Survival modes, design to 50 or 100-year return conditions |
| Station keeping | Gravity bases, piles, drag or suction anchors, catenary or taut moorings |
| Corrosion | Coatings, cathodic protection, corrosion allowance, duplex and composite parts |
| Bio-fouling | Antifouling coatings and planned cleaning |
| Fatigue | Millions of load cycles a year; fatigue-based design of structures and moorings |
| Sealing and water ingress | Redundant seals, condition monitoring, retrievable modules |
| Environment | Collision risk for marine life, noise during installation, sediment changes |
6.1Marine construction
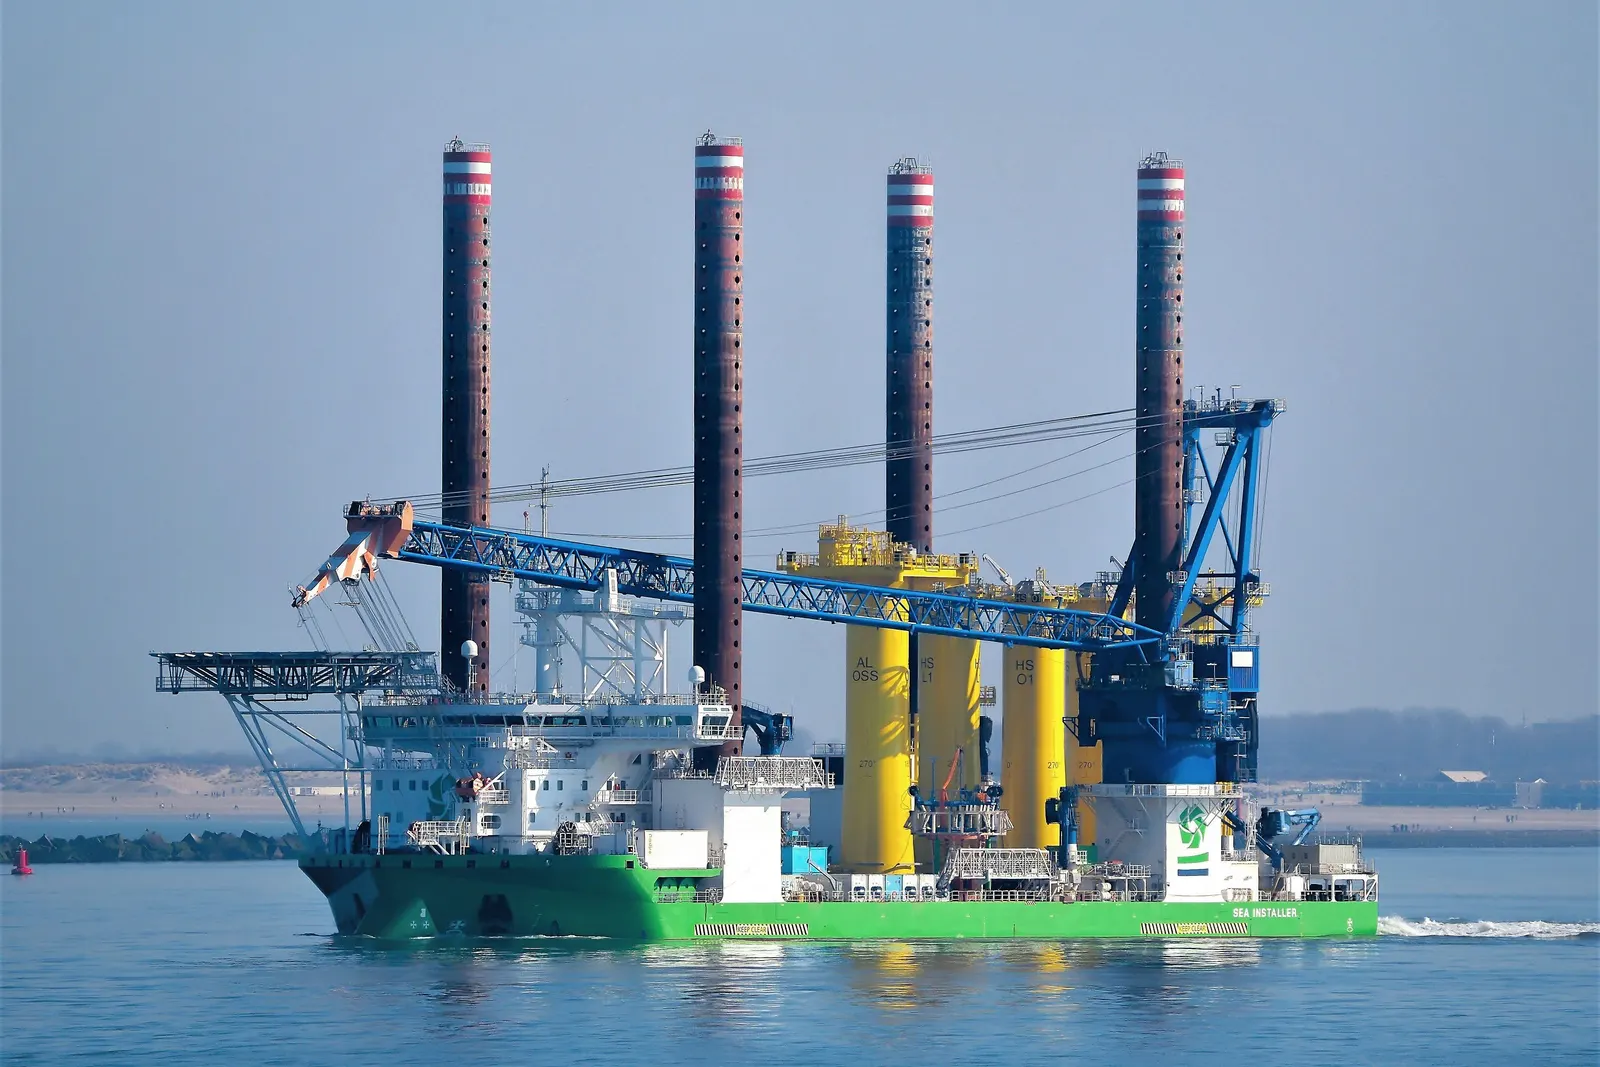
Section 07
Subsea Cables and Grid Connection
Power is brought ashore by subsea export cables to an onshore substation. On islands, ocean energy can feed a local grid together with solar, batteries and existing diesel sets.
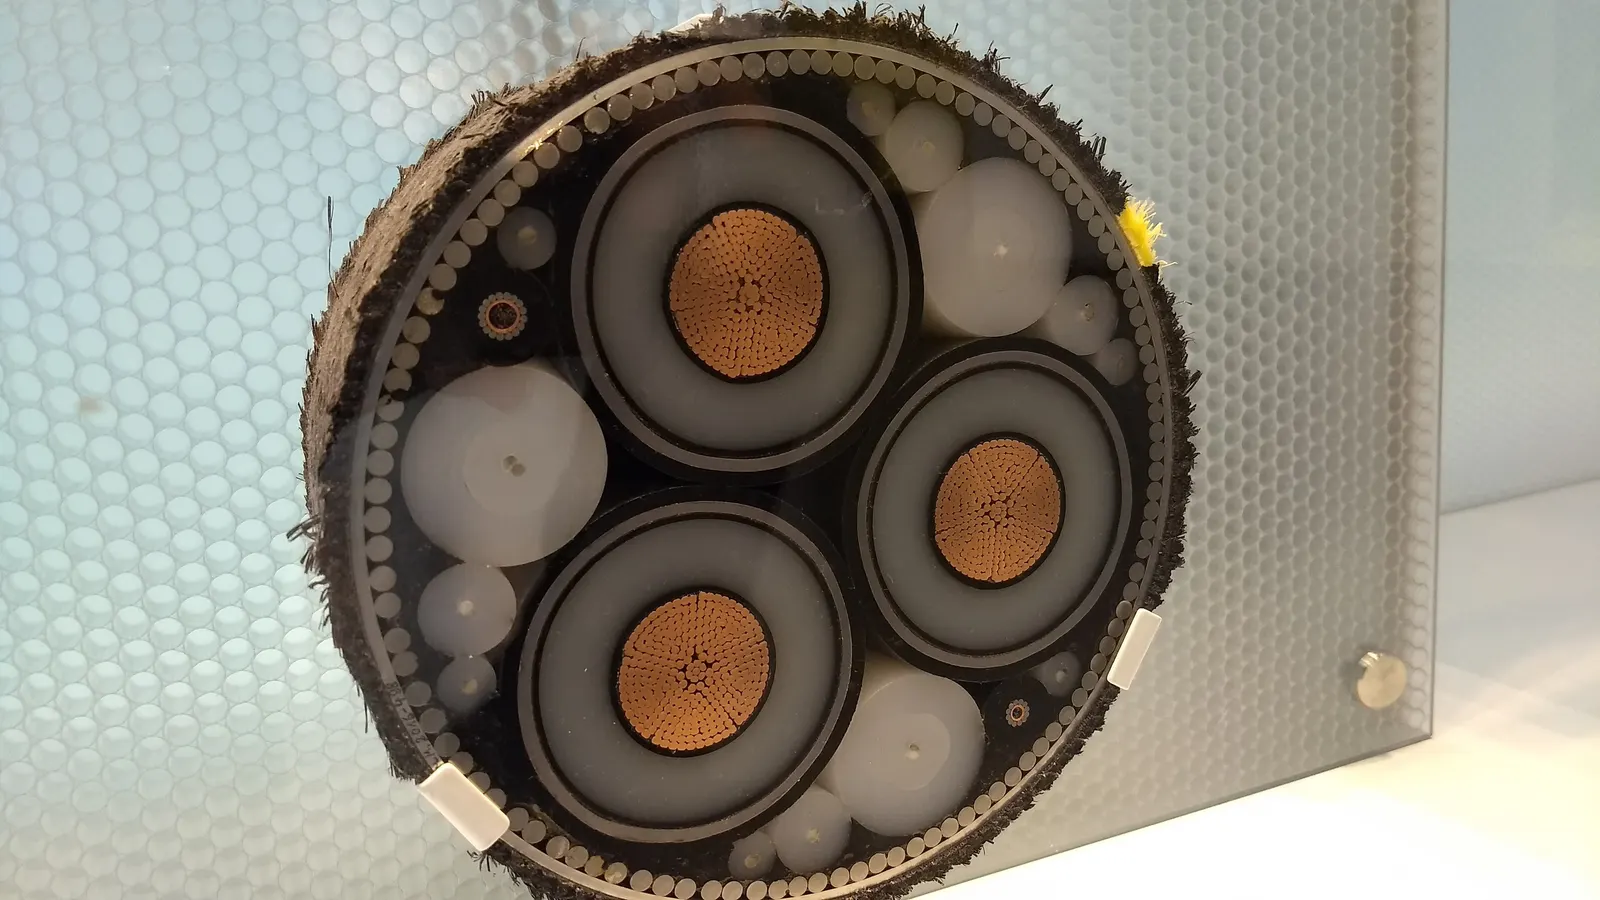
- Array cables with wet-mate or dry-mate connectors
- Subsea hubs to combine several devices
- Export cable route survey and burial or rock protection
- Horizontal directional drilling at the landfall
- Onshore substation and grid connectivity
- Power electronics and storage to smooth wave output
Cable and installation costs are a large share of early projects; sharing an export cable between devices or with offshore wind lowers the cost per MW.
Section 08
Project Development, Approvals and Standards
Ocean projects need rights to the seabed and sea area as well as the usual power-sector approvals, and they must fit around shipping, fishing, ports, defence and protected habitats.
- 1Resource screening and site shortlisting
- 2Stakeholder mapping: ports, fisheries, navy, coast guard, communities
- 3Metocean and seabed survey campaign
- 4Environmental and social impact assessment
- 5Coastal regulation zone and maritime clearances as applicable
- 6Seabed or sea area lease from the competent authority
- 7Grid connectivity and power purchase agreement
- 8Certification of the device and moorings
- 9Financial close and installation contracts
8.1Standards and guidance
- IEC TS 62600 series for marine energy converters (IEC TC 114)
- Resource assessment methods for wave and tidal sites
- Power performance testing at sea
- Classification-society rules for moorings and structures
- Test-centre protocols for staged sea trials
In India ocean energy in its various forms has been classed as renewable energy, so it can count towards renewable purchase obligations; project-specific approvals still apply.
Section 09
EPC, Fabrication and Marine Installation
BARREL coordinates fabrication yards, port logistics, marine contractors and the grid works, and plans installation around tides, monsoon seasons and weather windows.
Devices and structures
4- Device or turbine supply
- Foundations or floating hulls
- Moorings and anchors
- Quayside assembly and testing
Marine works
4- Survey and seabed preparation
- Vessel and crane chartering
- Foundation and device installation
- Cable lay and burial
Electrical
4- Array and export cables
- Subsea hub or connectors
- Onshore substation
- SCADA and remote monitoring
9.1Typical path for a first array
- Resource & surveys 1–2 yr
- Approvals & design 1–2 yr
- Fabrication 1 yr
- Installation in weather windows
- Staged commissioning
Section 10
Operation and Maintenance
Access at sea is limited by waves and currents, so ocean energy O&M is built around remote monitoring, robust components and quick retrieval of modules to the quayside.
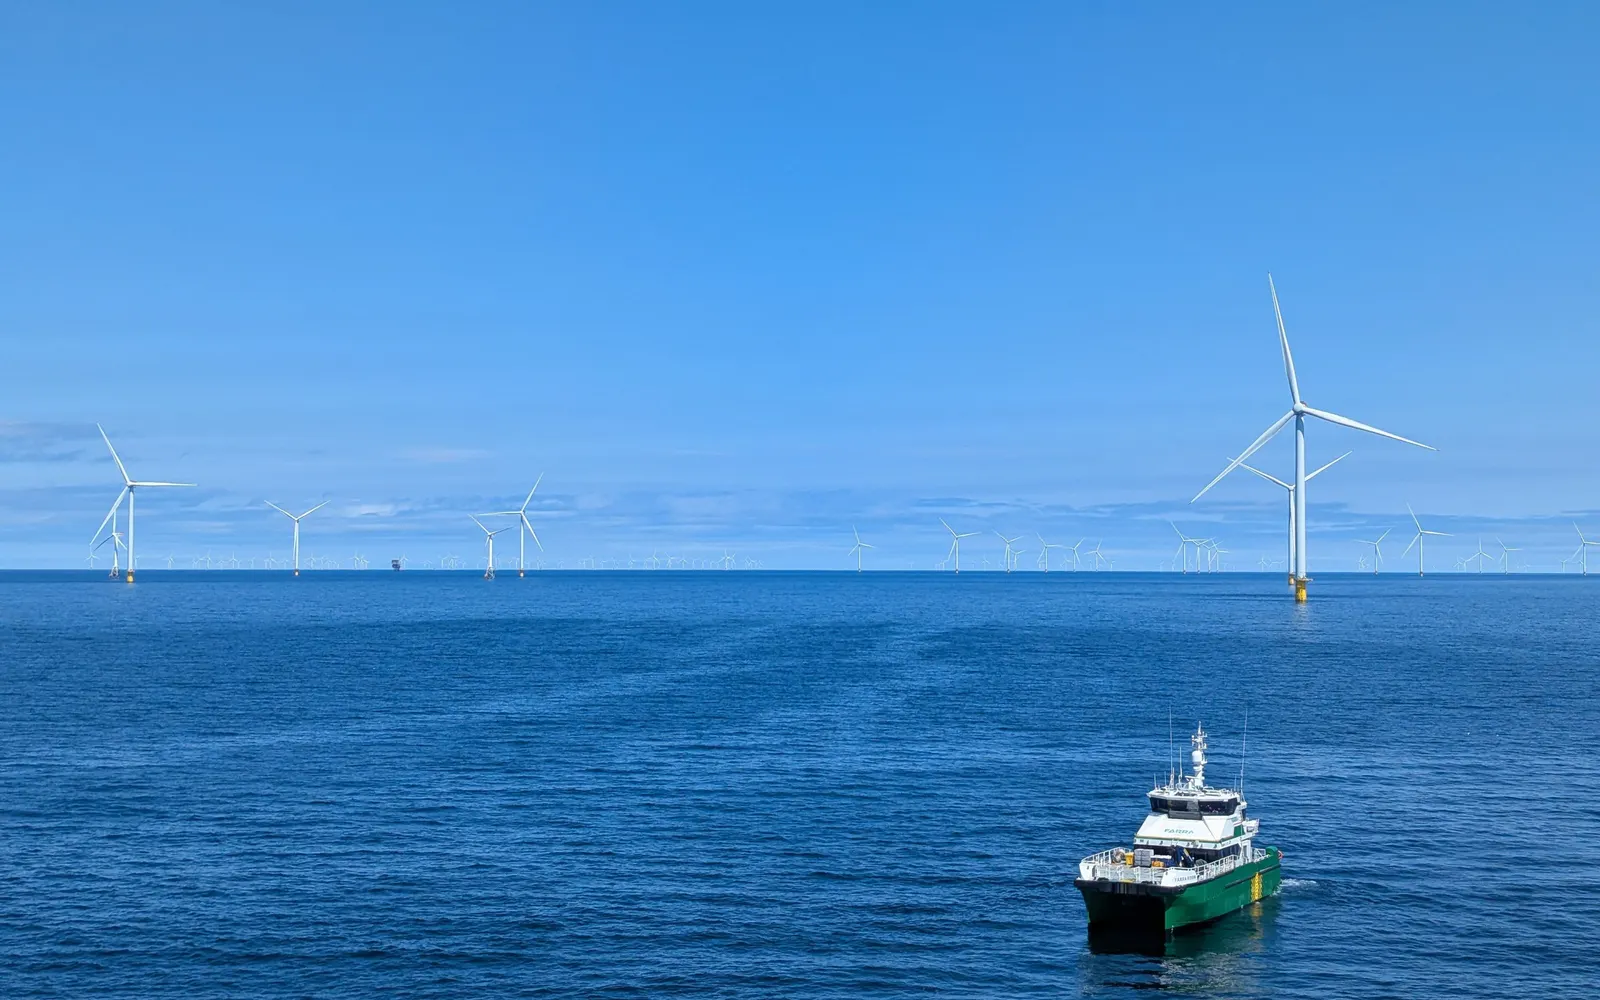
- Condition monitoring of power take-off, bearings and seals
- Weather-window planning for every sea visit
- Crew transfer vessels and lifting vessels on call
- Retrievable nacelles and modules for shore-side repair
- Mooring and cable inspections by ROV or divers
- Antifouling and corrosion protection renewal
- Performance analysis against resource data
- Environmental monitoring as set in the consent
- Decommissioning plan and financial provision
Section 11
Finance, Support Schemes and Outlook
Ocean energy still costs more than offshore wind or solar, so early projects rely on grants, test centres, ring-fenced auctions or higher tariffs. Costs are expected to fall with larger arrays, shared infrastructure and standard designs.
| Item | Typical position (international, indicative) |
|---|---|
| Tidal range | Very high capital cost, but long civil life of 100+ years |
| Tidal stream | Costs falling from early arrays; still above offshore wind |
| Wave energy | Pre-commercial; costs depend on survivability gains |
| OTEC | High cost; value improved by water and cooling by-products |
| Support routes | Grants, test-site berths, ring-fenced auctions, island diesel replacement |
| Best early markets | Islands, remote coasts, ports and offshore platforms |
Figures are indicative for early screening only; each site needs its own resource study, cost estimate and financial model.
Section 12
BARREL Services for Ocean Energy
One partner from the first metocean study to operation at sea, backed by BARREL's network of marine consultants, research bodies, fabricators, vessel operators and financiers.
- Resource screening and site selection
- Metocean and seabed survey coordination
- Technology screening and due diligence
- Feasibility study and DPR
- Environmental and maritime approvals support
- Owner's engineer and certification support
- Mooring, foundation and cable design coordination
- Fabrication and marine installation management
- Grid connectivity and PPA support
- Island hybrid systems with solar and storage
- Project finance and grant facilitation
- O&M planning and monitoring
Project desk
Explore ocean energy with BARREL
From the first tide gauge to power from the sea.
Studying a tidal or wave site, testing a device, planning power for an island or port, or looking at OTEC — tell us about the location and we will respond with the next steps.
Project categories
- Tidal range
- Tidal stream
- Wave energy
- Ocean current
- OTEC
- Island hybrid supply