
- Energy Storage
- Family 10
- Emerging
- Readiness Tracking
- Pilots & Partnerships
Emerging Storage Technologies
Sodium-Ion | Iron-Air | Flow | Liquid Metal | Carnot | CO₂ | Gravity | Metal Fuels
The next generation of storage — tracked, tested and brought to India.
A wave of new storage technologies aims at what today's lithium-ion batteries do less well: many hours or days of duration, lower cost per MWh stored, abundant materials and higher safety. A few are already in commercial plants; many are pilots or prototypes. BARREL tracks each one by readiness, checks claims through structured due diligence, designs and runs pilots with technology partners, and helps clients decide when a new technology is ready for their project — and when it is not.
TTrack
Readiness of each technology, reviewed regularly
PPilot
Prove it on an Indian site with clear tests
SScale
Bring proven ones into full-size EPC projects
- Technologies tracked
- 15+
- Target durations
- 4–100+ h
- Readiness range (2026)
- TRL 3–9
- Target materials
- Abundant
- BARREL approach
- Pilot first
Section 01
Emerging Storage — Overview
As solar and wind grow, grids need storage that lasts longer than the two to four hours that lithium-ion batteries usually serve, and that costs less for every extra hour. Supply-chain risk for lithium, cobalt, nickel and graphite adds a second reason to look for alternatives; fire safety in dense cities and hot climates adds a third.
This page covers technologies that are not yet mainstream in India. They are judged on the same basis as established ones: duration, efficiency, cost path, safety, materials, and — most of all — proven field performance. Readiness is BARREL's reading of public information as of 2026; it changes every year, sometimes every quarter.
1.1Four reasons new storage matters
01
Longer duration
Round-the-clock (RTC) and firm-and-dispatchable (FDRE) supply need 6–24 h of storage; seasonal balancing needs days or weeks.
02
Lower cost per hour
Technologies where extra hours cost little (tanks, sand, iron) can beat lithium-ion beyond a certain duration.
03
Abundant materials
Sodium, iron, zinc, sulphur, sand, air and CO₂ reduce dependence on imported critical minerals.
04
Safety
Water-based or non-flammable chemistries and thermal stores reduce fire risk near people and buildings.
1.2The technologies on this page at a glance
| Family | Technologies | Typical duration aimed at | Readiness band (2026) |
|---|---|---|---|
| New battery chemistries | Sodium-ion, solid-state, lithium-sulphur, zinc-based, liquid metal | 1–12 h | Pilot to early commercial |
| Multi-day batteries | Iron-air, some zinc and flow types | 24–100+ h | Demonstration |
| Flow batteries | Vanadium, all-iron, zinc-bromine, organic | 4–12 h | Commercial (vanadium) to pilot (organic) |
| Heat-based power stores | Carnot batteries, sand and rock stores, thermophotovoltaics | 6–100+ h | Prototype to early commercial (heat-only) |
| Gas and mechanical | CO₂ batteries, advanced gravity | 4–24 h | Demonstration |
| Chemical routes | Metal fuels (iron, aluminium), reversible fuel cells | Days to seasons | Prototype to pilot |
1.3Topics covered
- Readiness (TRL) tracking
- Sodium-ion
- Iron-air
- Solid-state
- Lithium-sulphur
- Zinc
- Liquid metal
- Flow batteries
- Carnot batteries
- Sand and rock heat
- Thermophotovoltaics
- CO₂ batteries
- Gravity
- Metal fuels
- Reversible fuel cells
- Due diligence
- Pilots
- Scale-up EPC
- Costs and LCOS
- India policy
Readiness changes quickly. The stages and figures on this page are BARREL's indicative reading of public literature and reported projects as of 2026, reviewed regularly. They are not endorsements of any company or product, and a technology's readiness must be re-checked at the time of any project decision.
Section 02
Readiness Tracking — How Mature Is a Technology?
A technology can work perfectly in a laboratory and still be years away from a bankable project. Readiness scales give a common language for that gap. BARREL uses the Technology Readiness Level (TRL, 1–9) alongside commercial and manufacturing readiness, because a bank asks different questions from a scientist.
A technology is only as ready as its weakest link: a proven cell in an unproven factory, or a proven plant without a warranty, is not yet ready for a lender.
2.1Readiness stages used by BARREL
| Stage | What it means | Typical TRL | What a buyer can do |
|---|---|---|---|
| Research | Laboratory cells and concepts | 1–3 | Watch; fund research links |
| Prototype | Working units tested in the lab | 4–5 | Watch; consider joint testing |
| Pilot | Small units (kW to low MW) in a real environment | 6 | Host a pilot with clear tests |
| Demonstration | MW-scale plants with real customers | 7 | Small project with risk-sharing |
| Early commercial | First commercial orders, warranties, limited history | 8 | Project with strong warranty and insurance |
| Established | Many plants, bankable track record, several suppliers | 9 | Normal tender and project finance |
2.2Other readiness scales worth knowing
Commercial Readiness Index (CRI)
4- 1 = hypothetical commercial proposition
- 3 = commercial scale-up
- 6 = bankable asset class
- Shows market maturity, not engineering
Manufacturing Readiness (MRL)
4- Can the factory make it repeatably?
- Yield, quality control, supply of materials
- Critical for new cell chemistries
- Often lags TRL by 2–3 levels
Adoption Readiness
4- Used by the US Department of Energy since about 2022
- Value proposition, market acceptance
- Resource maturity, licence to operate
- Explains why ready technologies still stall
2.3BARREL readiness tracker (indicative, as of 2026)
| Technology | Readiness band | Approx. TRL | Main thing still to prove |
|---|---|---|---|
| Vanadium flow | Established | 9 | Cost; vanadium price swings |
| Sodium-ion | Early commercial | 8 | Long field life; supplier depth outside China |
| Zinc-bromine / zinc hybrid | Early commercial | 7–8 | Long-term degradation data |
| All-iron flow | Demonstration to early commercial | 7–8 | Efficiency, side reactions at scale |
| Sand / rock heat (heat output) | Early commercial | 7–8 | Standard designs, cost at scale |
| Iron-air | Demonstration | 7 | Multi-year field data, efficiency, cost |
| CO₂ battery | Demonstration | 6–7 | First large plants operating as designed |
| Advanced gravity | Demonstration | 6–7 | Efficiency and cost of large plants |
| Liquid metal | Demonstration | 6–7 | Seals and corrosion over years at temperature |
| Carnot battery (power output) | Pilot | 5–7 | Round-trip efficiency at scale |
| Solid-state lithium (storage) | Pilot | 5–6 | Manufacturing yield and cost |
| Lithium-sulphur | Pilot | 5–6 | Cycle life |
| Reversible solid-oxide cells | Pilot | 5–6 | Stack life in both directions |
| Metal fuels (iron powder) | Pilot | 5–6 | Regeneration loop and economics |
| Organic flow | Prototype to pilot | 4–6 | Molecule stability over years |
| Thermophotovoltaic | Prototype | 4–5 | Cell cost and system efficiency |
TRL figures are BARREL's indicative judgement from public reports, papers and announced projects; different reviewers place the same technology one or two levels apart. Announcements are not operating plants — BARREL counts a plant only once it is reported in operation.
Section 03
Sodium-Ion Batteries
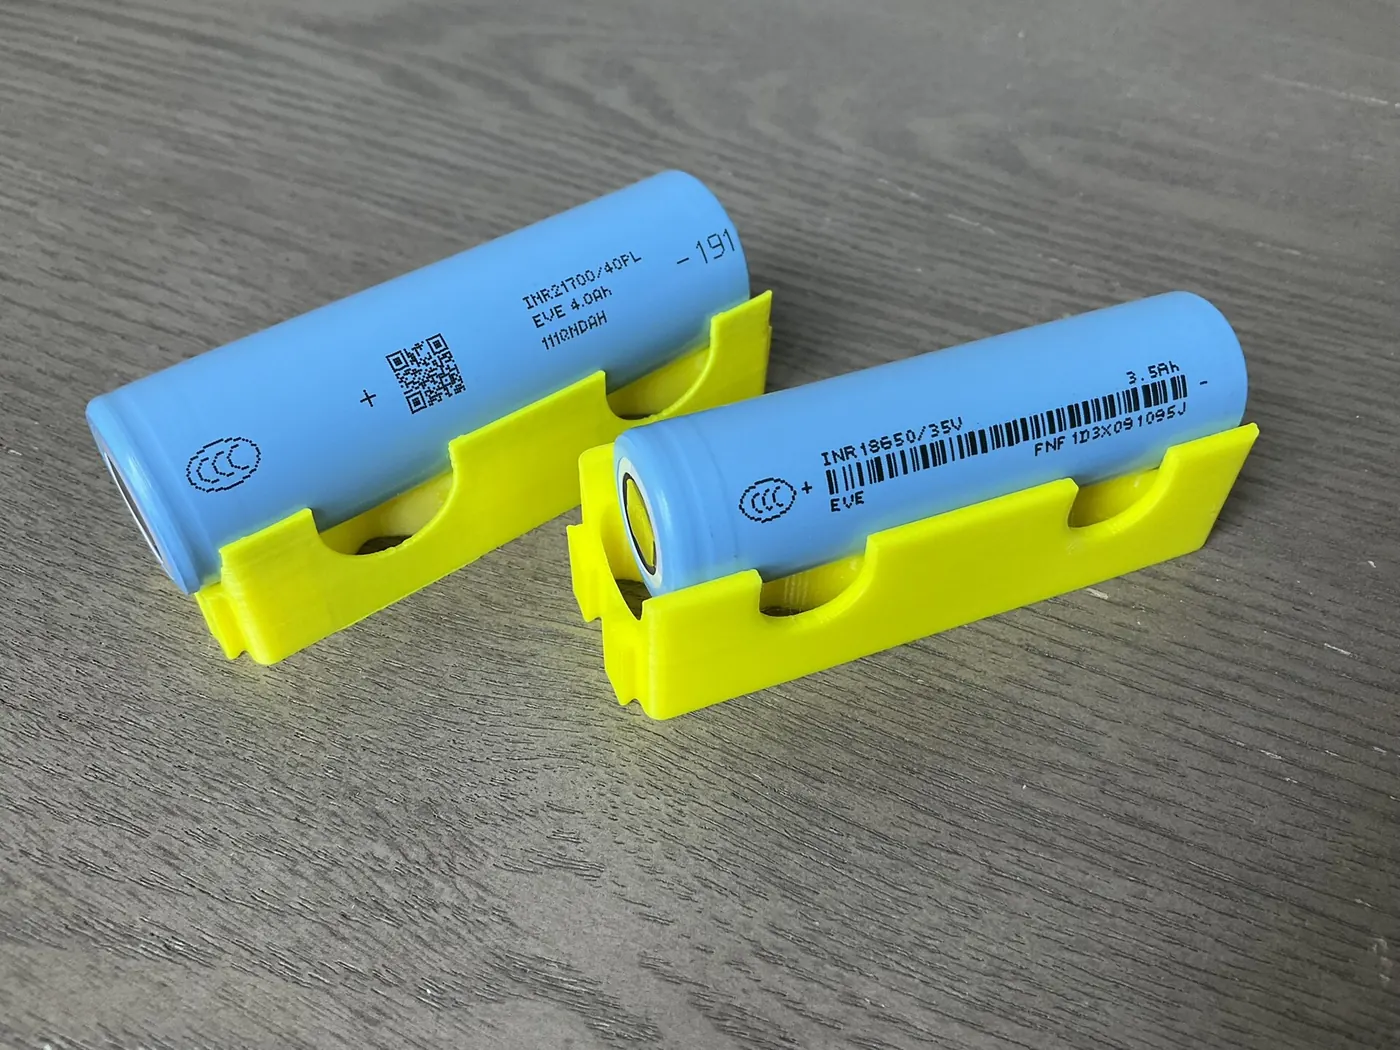
Sodium-ion cells work like lithium-ion cells — ions shuttle between two electrodes through an electrolyte — but use sodium, which is found in common salt and is far more abundant. They need no cobalt, nickel or lithium, and can use aluminium foil on both electrodes instead of copper.
Energy per kilogram is lower than lithium iron phosphate (LFP), so cells are heavier for the same energy. For stationary storage, weight matters less than cost, safety and cold-weather performance — which is why sodium-ion entered grid storage quickly once cell factories started in 2023.
3.1Main sodium-ion chemistries
Layered oxide cathodes
3- Highest energy of the sodium family
- Similar to lithium NMC in structure
- Used in early EV and storage cells
Prussian blue analogues
3- Cheap, open-framework iron compounds
- Fast charging
- Water content must be controlled tightly
Polyanion cathodes
3- Phosphate and sulphate based
- Longest cycle life, very stable
- Lower energy density
3.2Sodium-ion compared with LFP (indicative)
| Property | Sodium-ion | LFP lithium-ion |
|---|---|---|
| Cell energy density | ≈ 100–160 Wh/kg | ≈ 160–200 Wh/kg |
| Cycle life (to 80%) | ≈ 2,000–6,000+ (varies by chemistry) | ≈ 6,000–10,000 |
| Low-temperature performance | Good; useful capacity well below 0 °C | Weaker below 0 °C |
| Transport and storage | Some cells can be held at 0 V | Shipped partly charged |
| Anode | Hard carbon | Graphite |
| Critical minerals | None of lithium, cobalt, nickel | Lithium, graphite |
| Readiness for grid storage | Early commercial (TRL 8) | Established (TRL 9) |
3.3Where sodium-ion fits first
- Grid and C&I storage of 1–4 hours where cost and safety matter more than weight
- Cold-climate and high-altitude sites (Himalayan states, Ladakh)
- Telecom and UPS back-up replacing lead-acid
- Two- and three-wheelers and small EVs
- Hybrid packs mixing sodium-ion and LFP cells
- Markets that want to reduce lithium import dependence
Grid plants of around 100 MWh using sodium-ion cells were reported in operation in China from 2024. Field history is still only a few years long, so warranties and degradation curves deserve close review. Figures are indicative ranges from public literature.
Section 04
Iron-Air Batteries — Storage for Days
An iron-air battery stores energy by reversible rusting. On discharge, iron pellets react with oxygen from the air and turn into iron oxide (rust), releasing electrons. On charge, electricity turns the rust back into iron and releases oxygen. The electrolyte is water-based and non-flammable.
Iron is one of the cheapest metals on Earth, so the cost of each stored kWh can be very low. The trade-off is low round-trip efficiency and large footprint, so iron-air aims at 100-hour, multi-day duty — covering several cloudy or windless days — rather than daily cycling.
4.1How a charge and discharge cycle works
- Surplus solar or wind power arrives
- Charging turns iron oxide back into iron; oxygen is released
- Charged iron is held for hours or days with little loss
- On demand, air is drawn in and the iron oxidises
- Electrons flow out through the inverter to the grid
4.2Indicative characteristics
| Parameter | Indicative value |
|---|---|
| Duration aimed at | ≈ 100 h at rated power |
| Round-trip efficiency (AC) | ≈ 35–50% |
| Response time | Minutes (not suited to fast frequency response) |
| Materials | Iron, water, air, alkaline electrolyte |
| Footprint | Larger per MW than lithium-ion; modules in enclosures |
| Readiness (2026) | First utility-scale demonstrations in the USA (TRL 7) |
4.3Strengths and watch-points
01
Strengths
Very low energy cost target, abundant materials, no thermal runaway, long duration from one asset, useful for multi-day renewable lulls and resilience.
02
Watch-points
Low efficiency means more charging energy; field life and degradation are still being proven; slower response; supply chain and service network not yet established in India.
Iron-air efficiency and cost figures are developer targets and early public data, not long-term field results. Treat any iron-air project in India before about 2028 as a demonstration with risk-sharing, and re-check readiness at decision time.
Section 05
Solid-State and Lithium-Sulphur Batteries
Two lines of research try to get more out of lithium. Solid-state batteries replace the flammable liquid electrolyte with a solid one, aiming at higher safety and, with a lithium-metal anode, much higher energy density. Lithium-sulphur batteries swap the metal-oxide cathode for cheap sulphur, aiming at very light cells.
Both are driven mainly by electric vehicles and aviation, where weight matters most. Stationary storage will benefit later, once cost falls — for most grid projects in 2026 these remain technologies to watch rather than buy.
5.1Solid-state electrolyte families
Oxides
3- Ceramics such as garnet types
- Stable and safe
- Brittle; hard to make thin
Sulphides
3- Highest ionic conductivity
- Soft, easier to press
- Sensitive to moisture; can release H₂S
Polymers and hybrids
3- Flexible, easy to process
- Often need warmth to work well
- Semi-solid cells already in some EVs
5.2Indicative comparison
| Property | Solid-state lithium | Lithium-sulphur |
|---|---|---|
| Cell energy aimed at | ≈ 350–500 Wh/kg | ≈ 400–600 Wh/kg (theory far higher) |
| Main benefit | Safety and energy density | Very light, cheap cathode |
| Main problem | Manufacturing yield, interfaces, cost | Short cycle life (polysulphide shuttle) |
| First markets | Premium EVs, consumer devices | Drones, aviation, defence |
| Readiness for grid storage (2026) | Pilot (TRL 5–6) | Pilot (TRL 5–6) |
5.3What BARREL watches for before recommending them for storage
- Cells from a production line, not hand-built samples
- Thousands of full cycles at realistic temperatures (35–45 °C ambient in much of India)
- Cost per kWh approaching LFP
- Large-format cells and module designs for stationary use
- Fire and abuse test results (IEC 62619, UL 9540A) on the final product
Energy-density numbers above are research and developer targets reported in public literature; commercial cells for storage may be well below them.
Section 06
Zinc-Based and Liquid Metal Batteries
Zinc is cheap, plentiful (India is a major zinc producer) and works in water-based electrolytes, so zinc batteries are non-flammable. Several designs compete: zinc-bromine (with and without flowing electrolyte), zinc-ion, zinc-air and zinc-manganese.
Liquid metal batteries take a different path: two molten metals and a molten salt settle into three layers by density, like oil on water, at around 450–500 °C. With no solid electrodes to crack or wear, they aim at very long life with little fade.
6.1Zinc battery types (indicative)
| Type | How it works | Duration | Readiness (2026) |
|---|---|---|---|
| Zinc-bromine flow | Zinc plates on charge; bromine held in electrolyte | 4–10 h | Early commercial (TRL 7–8) |
| Zinc-bromine static (gel) | No pumps; electrolyte held in the cell | 4–12 h | Early commercial (TRL 7–8) |
| Zinc-ion / zinc-manganese | Zinc ions shuttle in mild aqueous electrolyte | 2–8 h | Pilot (TRL 6) |
| Zinc-air (rechargeable) | Zinc oxidised by air, like iron-air | 8–100 h | Pilot to demonstration (TRL 6–7) |
6.2How a liquid metal cell works
- 1The cell is heated to operating temperature (≈ 450–500 °C) and kept hot by its own losses when cycling
- 2A light liquid metal sits on top, a molten salt in the middle, a dense liquid metal at the bottom
- 3On discharge, the top metal gives up electrons and its ions cross the salt to alloy with the bottom metal
- 4On charge, electricity reverses the process and the top metal is restored
- 5Because the electrodes are liquid, they do not crack or wear, so fade is low
6.3Watch-points
01
Zinc
Dendrites (needle growth) on charging, side reactions producing hydrogen, and bromine handling in zinc-bromine designs. Ask for independent cycle data at Indian temperatures.
02
Liquid metal
Long hot standby needs heat management; seals and container corrosion over many years at temperature; only a few demonstration units worldwide so far.
Operating temperature and duration ranges are indicative from published research and developer information.
Section 07
Flow Batteries — Vanadium, All-Iron, Zinc-Bromine and Organic
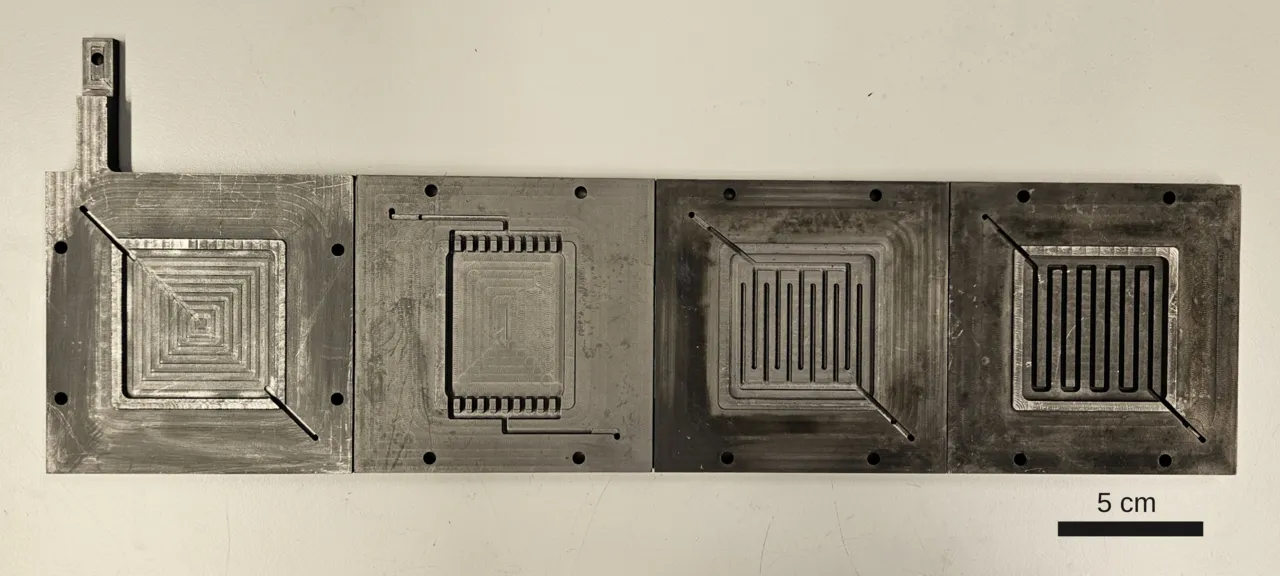
A flow battery keeps its energy in liquid electrolytes held in tanks and converts it in a separate cell stack, with pumps moving the liquid between them. Power (the stack) and energy (the tanks) are sized separately, so adding hours means adding tank volume and electrolyte rather than more cells.
Vanadium flow is the most established, with plants of hundreds of MWh — a 100 MW / 400 MWh first phase in Dalian, China came online in 2022. All-iron, zinc-bromine and organic flow batteries aim at cheaper, more abundant materials, but are earlier in readiness.
7.1Flow battery in five steps
- Positive and negative electrolytes stored in two tanks
- Pumps circulate both through the cell stack
- A membrane separates them; ions cross, electrons go round the circuit
- Charge state changes in the liquid, not in solid electrodes
- Inverter converts DC to AC for the grid
7.2Flow chemistries compared (indicative)
| Chemistry | Active materials | RTE (AC) | Readiness (2026) | Notes |
|---|---|---|---|---|
| Vanadium redox (VRFB) | Vanadium in sulphuric acid, both sides | ≈ 60–75% | Established (TRL 9) | No cross-contamination; electrolyte reusable; vanadium price risk |
| All-iron | Iron salts in water | ≈ 60–70% | Demonstration to early commercial (TRL 7–8) | Very cheap materials; hydrogen side reaction managed by rebalancing |
| Zinc-bromine | Zinc and bromine in water | ≈ 60–70% | Early commercial (TRL 7–8) | Zinc plates during charge, so energy is not fully decoupled |
| Aqueous organic | Engineered carbon-based molecules | ≈ 55–70% | Prototype to pilot (TRL 4–6) | Could avoid metals entirely; molecule stability is the key question |
| Hydrogen-bromine | Hydrogen gas and bromine | ≈ 60–70% | Pilot (TRL 6) | High power; bromine handling |
7.3Why flow batteries matter — and what to watch
Advantages
5- Energy scales with tank volume
- Little degradation over 20+ years (vanadium)
- Water-based electrolytes; no thermal runaway
- Electrolyte can be leased, recovered or recycled
- Deep cycling with full depth of discharge
Watch-points
5- Lower efficiency than lithium-ion
- Bigger footprint (≈ 15–25 Wh per litre of electrolyte for vanadium)
- Pumps, valves and membranes need maintenance
- Acid or bromine handling and containment bunds
- Higher cost at short durations
Efficiency, energy density and readiness figures are indicative ranges from public literature and reported plants. Flow batteries also have their own page in BARREL's Battery Storage family.
Section 08
Carnot Batteries, Sand and Rock Heat Stores, and Thermophotovoltaics
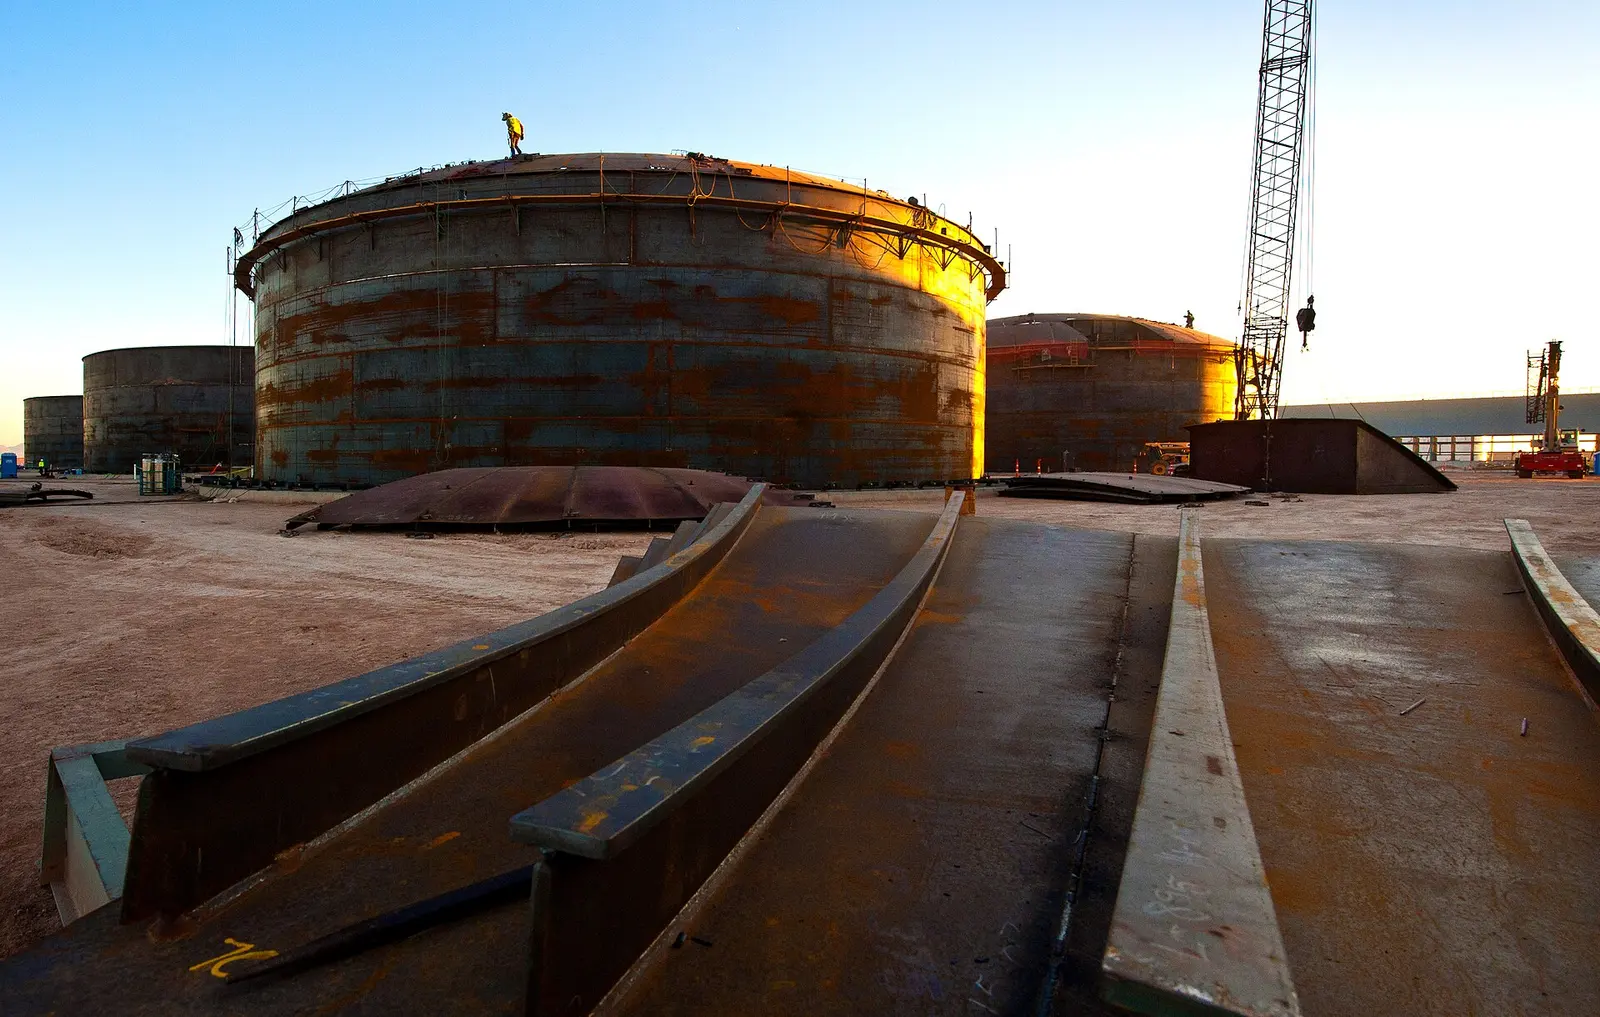
A Carnot battery turns electricity into heat (with an electric heater or, more efficiently, a heat pump), stores the heat in cheap materials such as sand, rock, concrete or molten salt, and later turns it back into electricity with a turbine or engine. The name comes from the Carnot limit that sets how much heat can become work.
Turning heat back into power loses a lot — so the best economics often come from selling the heat itself to industry or district heating, with power only part of the time. Thermophotovoltaics (TPV) take a different route: a store glowing at 1,500–2,400 °C shines light onto special PV cells.
8.1Main concepts
01
Pilot to demonstrationResistive heat + steam turbine
Electric heaters charge a rock, sand or salt store; steam turbine discharges. Simple; power-to-power ≈ 30–45%.
02
PilotPumped thermal (heat pump)
A heat pump creates a hot and a cold store; a heat engine runs between them. Theory aims at 50–70%.
03
Early commercial (heat)Sand and rock heat stores
Cheap solid media heated to 500–1,000 °C supplying process heat or district heat; commercial sand stores have run in Finland since 2022.
04
Studies and pilotsRepurposed coal plants
A heat store feeds an existing coal plant's steam cycle, reusing turbine, grid connection and staff.
05
PrototypeThermophotovoltaic (TPV)
Very hot stores emit light onto PV cells tuned to it; lab cells reached around 40% efficiency in 2022.
06
PilotLatent heat stores
Phase-change materials (salts, metals, silicon) store heat at a constant temperature.
8.2Storage media (indicative)
| Medium | Temperature range | Specific heat | Notes |
|---|---|---|---|
| Sand / crushed rock | Up to ≈ 600–1,000 °C | ≈ 0.8–1.0 kJ/kg·K | Very cheap; local material |
| Concrete / ceramics | Up to ≈ 600 °C | ≈ 0.8–1.0 kJ/kg·K | Modular blocks with embedded pipes |
| Molten nitrate salt | ≈ 290–565 °C | ≈ 1.5 kJ/kg·K | Proven in solar thermal plants |
| Graphite / carbon blocks | Up to ≈ 2,000 °C+ | ≈ 0.7–2.0 kJ/kg·K (rises with temperature) | For TPV and very high-temperature concepts |
| Molten silicon (latent) | ≈ 1,414 °C melting | ≈ 1.8 MJ/kg latent | Research stage |
8.3Where heat-based stores fit in India
- Industries needing steam or hot air (textiles, food, chemicals, paper) charged from cheap solar
- Retiring or under-used coal units that could be converted to thermal storage plants
- Hybrid heat-and-power offtake for industrial parks
- Very long-duration stores where heat losses are small relative to size
Efficiencies quoted are indicative ranges from public studies. Power-to-heat-to-power efficiency is low; heat-to-heat use is much higher (often 90%+). See BARREL's Thermal Storage page for proven molten-salt and hot-water storage.
Section 09
CO₂ Batteries and Advanced Gravity Storage
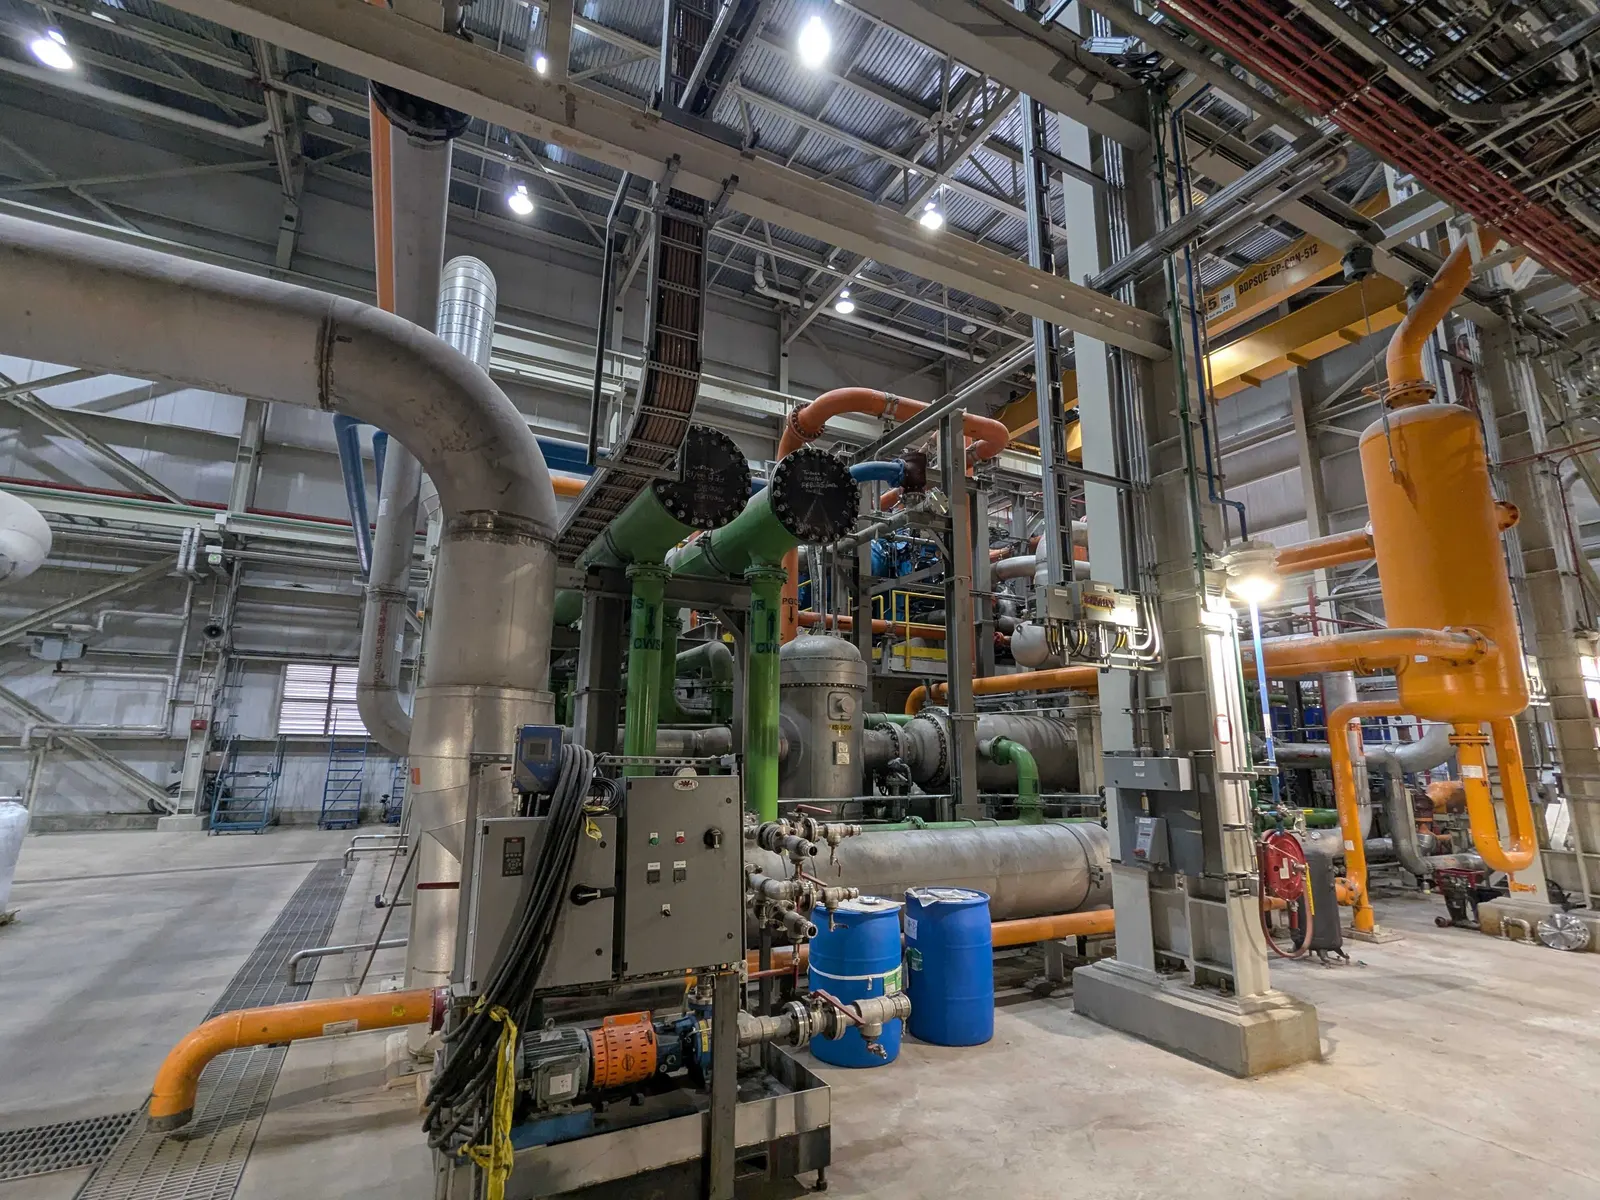
A CO₂ battery is a closed loop: carbon dioxide is held at near-atmospheric pressure in a large flexible dome, compressed into liquid in steel tanks when power is cheap (the heat of compression is stored), then warmed and expanded through a turbine when power is needed. The CO₂ is never released; it is only the working fluid.
Advanced gravity systems lift heavy blocks or weights with electric motors and lower them to generate power — in towers, in purpose-built buildings or down disused mine shafts. Physics is simple; the challenge is cost, efficiency and civil works at scale.
9.1Indicative characteristics
| Parameter | CO₂ battery | Advanced gravity |
|---|---|---|
| Typical size aimed at | ≈ 20 MW / 200 MWh modules | ≈ 1–25 MW, 4–8 h |
| Round-trip efficiency (developer claims) | ≈ 70–75% | ≈ 75–85% (block systems; shaft systems higher) |
| Main components | Gas dome, compressor, turbine, heat store, liquid CO₂ tanks | Cranes or winches, motor-generators, blocks, structure or shaft |
| Land use | Large dome; several hectares for 200 MWh | Tall structures or existing shafts |
| Readiness (2026) | Demonstration (TRL 6–7) | Demonstration (TRL 6–7) |
9.2CO₂ battery cycle
- CO₂ gas stored in a dome at about atmospheric pressure
- Compressor liquefies it; heat of compression goes to a thermal store
- Liquid CO₂ held in pressure tanks at ambient temperature
- Discharge: liquid evaporates, is reheated from the thermal store
- Hot CO₂ expands through a turbine; gas returns to the dome
9.3Reported reference projects
01
CO₂ demonstration, Sardinia
A 2.5 MW / 4 MWh CO₂ battery demonstration has operated in Sardinia, Italy since 2022; larger 200 MWh-class plants have been announced in several countries, including India.
02
Tower-type gravity, China
A 25 MW / 100 MWh block-based gravity plant in Jiangsu province was reported complete in 2024.
03
Mine-shaft gravity
Test rigs in the UK and studies in disused mines in Europe and elsewhere; India's closed coal mine shafts are a possible future site type.
Efficiency figures are developer claims and early data, not independent long-term results. Announced plants are counted as references only once reported in operation; check current status at decision time.
Section 10
Metal Fuels, Reversible Fuel Cells and Other Chemical Routes
Beyond hydrogen and ammonia (covered on BARREL's Chemical Storage page), new carriers and devices are being tested for very long, even seasonal, storage. Metal fuels store energy in metal powder: iron powder burns to iron oxide giving heat, and the oxide is turned back into iron using green hydrogen or electricity — a closed loop with no carbon.
Reversible fuel cells use one device for both jobs: as an electrolyser they turn power into hydrogen, and run backwards as a fuel cell they turn hydrogen into power, halving the equipment needed for power-to-power storage.
10.1Chemical routes (indicative)
| Route | How it stores energy | Output | Readiness (2026) |
|---|---|---|---|
| Iron powder | Iron oxide reduced to iron with hydrogen; iron burned later | Heat (industrial steam) | Pilot (TRL 5–6); MW-scale industrial trials in Europe since 2020 |
| Aluminium | Aluminium reacts with water giving hydrogen and heat | Heat and hydrogen | Prototype (TRL 4–5); regeneration needs smelting |
| Reversible solid-oxide cell (rSOC) | Steam electrolysis at 600–850 °C, then fuel-cell mode | Power and heat | Pilot (TRL 5–6) |
| Liquid organic hydrogen carriers | Hydrogen bonded to an oil-like liquid | Hydrogen | Demonstration (TRL 6–7) |
| Thermochemical heat | Reversible reactions (salt hydrates, metal oxides) | Heat | Prototype to pilot (TRL 4–6) |
10.2Strengths and watch-points
01
Strengths
Almost no loss over months; dense, shippable carriers; can serve industrial heat where electricity alone struggles; reversible cells reduce equipment cost.
02
Watch-points
Low power-to-power efficiency (rSOC ≈ 40–60%; metal fuel cycles mostly sold as heat); regeneration needs cheap hydrogen or high-temperature plant; few long-run pilots.
Efficiency figures are indicative from research literature and early pilots. Hydrogen, ammonia and e-fuels are treated as established chemical storage on BARREL's Chemical Storage page.
Section 11
System Architecture, Power Conversion, Controls and Grid Integration
Whatever the storage medium, the plant around it looks similar: the store itself, a way to put energy in and take it out (inverters, motors, compressors, turbines), auxiliary systems, controls and a grid connection. Much of the risk in a first-of-a-kind project sits in this balance of plant, not in the core technology.
Electrochemical types (sodium-ion, iron-air, flow, zinc) connect through power conversion systems (PCS) like any battery. Thermal and mechanical types (Carnot, CO₂, gravity) connect through rotating machines — which also bring inertia and short-circuit strength that inverters lack.
11.1Building blocks of an emerging-storage plant
Core store
3- Cells, modules, stacks or tanks
- Thermal media and insulation
- Gas dome, pressure tanks or weights
Conversion
3- PCS / bidirectional inverters (electrochemical)
- Motors, compressors, pumps
- Turbines, generators, heat engines
Balance of plant
4- Cooling, HVAC, heat exchangers
- Auxiliary power and UPS
- Fire detection and suppression
- Water treatment where needed
Electrical
3- LV/MV switchgear, transformers
- Protection relays, metering
- Harmonic filters, reactive compensation
Controls
3- Battery or plant management system
- Energy management system (EMS)
- SCADA and RTU to load despatch centre
Grid interface
3- 33 kV to 400 kV substation bay
- Grid code compliance (CEA connectivity regulations)
- Scheduling and forecasting interface
11.2Grid interface by technology type
| Technology type | Grid interface | Inertia | Fast response |
|---|---|---|---|
| Sodium-ion, zinc, solid-state | Inverter (grid-following or grid-forming) | Synthetic only | Milliseconds |
| Flow batteries | Inverter; pumps add auxiliary load | Synthetic only | Milliseconds to seconds |
| Iron-air | Inverter | Synthetic only | Minutes for full power |
| Carnot / CO₂ / liquid air | Synchronous generator via turbine | Real rotating inertia | Minutes (seconds once spinning) |
| Gravity | Motor-generator, often with inverter drive | Depends on drive | Seconds |
11.3What the EMS must do for a new technology
- Respect the technology's real limits (ramp rates, minimum load, warm-up, rest periods)
- Track true state of charge, which may behave differently from lithium-ion
- Log everything needed to prove performance against the pilot's success tests
- Stack services: arbitrage, peak support, RTC firming, ancillary services
- Coordinate with co-located solar, wind or a lithium-ion battery in hybrid plants
- Cyber security to IEC 62443 and CEA cyber security guidelines
Section 12
Sizing and Design Calculations
The key question for most emerging technologies is not whether they work, but at what duration they become cheaper than lithium-ion. The answer comes from splitting cost into a power part (₹ per kW, for inverters, stacks, turbines) and an energy part (₹ per kWh, for cells, tanks, sand or iron).
The formulas below, and the live estimator, use that split. All inputs are indicative and should be replaced with quotes for a real project.
12.1Capital cost from power and energy parts
Two-part capex
CAPEX = P × c_P + P × h × c_E
100 MW × 10 h, c_P ₹10,000/kW, c_E ₹12,000/kWh → ₹100 cr + ₹1,200 cr = ₹1,300 crore
A short-duration technology has a low power cost but a high energy cost; a long-duration technology the reverse. Doubling the hours doubles only the energy part.
| Symbol | Meaning |
|---|---|
| P | Rated power (kW) |
| h | Duration at rated power (hours) |
| c_P | Power-related cost (₹/kW) |
| c_E | Energy-related cost (₹/kWh) |
12.2Crossover duration
Where Tech B becomes cheaper
h* = (c_P,B − c_P,A) ÷ (c_E,A − c_E,B)
A: ₹10,000/kW + ₹12,000/kWh; B: ₹90,000/kW + ₹3,000/kWh → h* = 80,000 ÷ 9,000 ≈ 8.9 h
Below h* the technology with the cheaper power part (A) costs less; above h* the one with the cheaper energy part (B) wins. At 10 h in this example A costs ₹1,300 crore and B ₹1,200 crore for 100 MW.
| Symbol | Meaning |
|---|---|
| h* | Crossover duration (hours) |
| A | Technology with lower power cost (e.g. lithium-ion) |
| B | Technology with lower energy cost (e.g. a long-duration type) |
12.3Charging energy and round-trip efficiency
Energy you must buy
E_in = E_out ÷ η_RT
1,000 MWh delivered at 45% RTE → 2,222 MWh charged; at 85% → 1,176 MWh
Low efficiency is not a deal-breaker if charging power is cheap or would otherwise be curtailed, but it raises the cost of each delivered kWh and the solar or wind capacity needed.
| Symbol | Meaning |
|---|---|
| E_out | Energy delivered to the grid (MWh) |
| η_RT | Round-trip efficiency, AC to AC |
12.4Simplified levelised cost of storage
LCOS (₹/kWh delivered)
LCOS ≈ (CAPEX × CRF + O&M) ÷ E_year + c_charge ÷ η_RT
₹1,200 cr, CRF 0.1175 (10%, 20 yr), O&M ₹24 cr/yr, 300,000 MWh/yr, ₹3/kWh at 45% → ≈ ₹5.5 + ₹6.7 = ₹12.2/kWh
The first term is the cost of the plant spread over each kWh it delivers; the second is the cost of the charging energy grossed up for losses. CRF = r(1+r)^n ÷ ((1+r)^n − 1). Multi-day stores cycle fewer times a year, so E_year is smaller and the first term grows — they compete on resilience and firm-capacity value rather than daily arbitrage.
| Symbol | Meaning |
|---|---|
| CRF | Capital recovery factor |
| r, n | Discount rate and life in years |
| E_year | Energy delivered per year (kWh) |
| c_charge | Cost of charging electricity (₹/kWh) |
12.5Store size checks
Flow electrolyte and sand mass
V = E ÷ e_v · m = Q ÷ (c × ΔT)
1 MWh VRFB at 25 kWh/m³ → ≈ 40 m³ electrolyte; 100 MWh(th) in sand, c 0.8 kJ/kg·K, ΔT 400 K → ≈ 1,125 t (≈ 750 m³)
Quick checks of tank volume and store mass show land and civil needs early. One tonne of sand cycled through 400 K holds about 89 kWh of heat.
| Symbol | Meaning |
|---|---|
| e_v | Usable energy per m³ of electrolyte |
| c | Specific heat of the medium |
| ΔT | Temperature swing between hot and cold (K) |
12.6Live estimator
Compare two technologies on capital cost. Enter the power in MW and the duration in hours, then for Tech A and Tech B a power cost (₹/kW) and an energy cost (₹/kWh). The estimator shows the capex of each in ₹ crore, the cost per kWh of storage, and the crossover duration beyond which Tech B becomes cheaper than Tech A. It covers capital cost only — not efficiency, life, cycling or O&M.
Estimate
- Tech A capex
- ₹1,220 crore
- Tech B capex
- ₹800 crore
- Tech A per kWh
- ₹15,250
- Tech B per kWh
- ₹10,000
- Equal cost at
- 4.3 h
Default A is a lithium-ion-like profile (cheap power, dear energy) and B a long-duration profile (dear power, cheap energy) — illustrative numbers, not quotes. Preliminary screening only; BARREL confirms any figure with a site study.
All worked examples use illustrative inputs, not quotations or tender results. Real costs vary with size, site, supplier, exchange rate and year; BARREL replaces them with vendor quotes and a full LCOS model in feasibility work.
Section 13
How BARREL Evaluates a New Technology
Before a new technology goes into a client project, it passes a structured technical and commercial review. The aim is simple: separate what has been measured in the field from what is a target or a laboratory result.
The same review serves a utility choosing a pilot, an investor looking at a developer, and a technology company preparing to enter India.
13.1Review steps
- 1Define the duty: power, duration, cycles per year, climate, grid services
- 2Collect claims: efficiency, life, degradation, cost, response time, footprint
- 3Check evidence: independent test reports, field data, third-party engineer reviews
- 4Safety: cell, module and system tests (IEC 62619, IEC 62933-5, UL 9540A where relevant)
- 5Supply chain: materials, factory capacity, yield, local assembly options
- 6Company strength: balance sheet, warranty backing, insurance, service network
- 7India fit: 45 °C+ ambient, dust, humidity, grid code, tender terms, import duties
- 8Cost path: capex, O&M, augmentation, end-of-life, LCOS against lithium-ion
- 9Recommendation: watch, pilot, demonstrate with risk-sharing, or deploy
13.2Common red flags
| Claim pattern | What to ask |
|---|---|
| Efficiency quoted at DC or cell level | AC-to-AC round-trip efficiency including auxiliaries and standby loss |
| Life quoted in years only | Cycles, depth of discharge, temperature and end-of-life capacity |
| Cost quoted per kWh of cells | Installed system cost incl. PCS, civil, grid, EPC margin |
| Plant counted from an announcement | Commissioning date and operating data |
| Warranty from a young company | Parent guarantee, escrow, insurance-backed warranty |
| Lab tests at 25 °C | Results at 40–50 °C ambient and in dusty conditions |
13.3Typical deliverables
- Technology due diligence report with readiness rating
- Performance and degradation model for the client's duty
- Risk register with mitigations
- Cost and LCOS comparison against lithium-ion and pumped storage
- Contract term sheet points (performance guarantees, liquidated damages)
- Go / no-go recommendation and pilot plan
Section 14
Pilots and Scale-Up — Proving It in India
A good pilot answers specific questions in a limited time and budget. It is sized large enough to be representative (often 100 kW to a few MW), installed on a real site with real duty, and measured against success tests agreed before it starts.
Scale-up follows a staged path. Each step is approved only when the previous one has met its tests, so risk rises in step with evidence.
14.1Staged path to a full project
- Technology watch and desk review
- Laboratory or container test (kW)
- Field pilot on an Indian site (0.1–5 MW)
- Demonstration plant (5–50 MW) with risk-sharing
- First commercial project with full warranties
- Repeat projects and local manufacturing
14.2Example pilot success tests
| Test | What is measured | Typical duration |
|---|---|---|
| Capacity | Usable MWh at rated power, beginning and end of pilot | Start, then every quarter |
| Round-trip efficiency | AC-in vs AC-out including auxiliaries | Monthly average |
| Availability | Hours available ÷ hours in period | Whole pilot |
| Degradation | Capacity fade per cycle and per year | 12–24 months |
| Climate | Performance through summer peak and monsoon | At least one full year |
| Grid response | Ramp, response time, grid-code tests | Commissioning and repeat |
| O&M effort | Service visits, spares, faults | Whole pilot |
14.3Ways to share pilot risk
01
Developer-funded pilot
Technology company supplies equipment; host provides site and grid; data shared.
02
Grant-supported pilot
Public research or innovation funds cover part of cost; results published.
03
Performance-based contract
Payments linked to measured capacity, efficiency and availability.
Pilot sizes and durations are typical industry practice, not fixed rules. A pilot should be planned with its exit decision written down at the start.
Section 15
Turnkey EPC and Engineering Deliverables
First-of-a-kind plants need tighter engineering control than repeat projects. The technology supplier usually owns the core store and its performance; the EPC contractor owns site, civil, electrical, integration and grid connection. Interfaces between the two are where projects slip, so they are defined early and in writing.
BARREL can deliver the full scope or act as owner's engineer alongside a technology supplier.
15.1Project phases
| Phase | Main work | Typical time |
|---|---|---|
| Concept and feasibility | Duty study, technology screening, site options, LCOS | 1–3 months |
| Due diligence and pilot | Technology review, pilot design and operation | 6–24 months |
| Basic engineering | Layout, single-line diagram, grid studies, permits | 2–4 months |
| Detailed engineering and procurement | Drawings, specifications, vendor packages | 3–6 months |
| Construction and installation | Civil, mechanical, electrical, controls | 6–18 months |
| Testing and commissioning | Factory, site and grid tests | 1–3 months |
15.2Typical work packages
Technology package
3- Core store (cells, stacks, tanks, thermal store)
- Plant management system
- Performance guarantees
Electrical package
3- PCS, transformers, switchgear
- Protection, metering, SCADA
- Substation and line bay
Civil package
3- Foundations, roads, drainage
- Bunds for liquids, fire walls
- Buildings, domes or shafts
15.3Engineering deliverables register (extract)
| Deliverable | Purpose |
|---|---|
| Duty and sizing report | Power, energy, cycles, degradation and augmentation plan |
| Single-line diagram | Electrical arrangement from store to grid |
| Plant layout and fire-zone plan | Spacing, access, separation distances |
| Grid studies | Load flow, short circuit, harmonics, dynamic models for connectivity |
| Hazard study (HAZID / HAZOP) | Chemical, thermal, pressure and fire hazards |
| Interface matrix | Who supplies, connects and tests each item |
| Testing and commissioning plan | Factory, site and performance tests with acceptance criteria |
| O&M manual and spares list | Routine tasks, critical spares, training |
15.4Delivery models
01
Full EPC
One contract for the whole plant, with technology supplied through an OEM partner and back-to-back guarantees.
02
Split EPC
Technology supply contract with the OEM; BARREL builds balance of plant and integrates.
03
Owner's engineer
BARREL reviews designs, supervises and witnesses tests for the owner or lender.
Section 16
Equipment, Supply Chain and Manufacturing in India
Many emerging technologies use materials India already has or makes: sodium salts, iron, zinc, steel, sand, concrete, CO₂ and standard turbines, compressors and pumps. That makes local manufacturing more realistic than for lithium-ion cells, whose minerals are mostly imported.
India's production-linked incentive (PLI) for advanced chemistry cells is technology-neutral, so cell chemistries such as sodium-ion can qualify if they meet its performance thresholds.
16.1Local supply potential (indicative)
| Technology | Key materials and parts | India supply today |
|---|---|---|
| Sodium-ion | Sodium carbonate, hard carbon, aluminium foil, electrolyte salts | Raw materials available; cell lines at early stage |
| Iron-air | Iron, alkaline electrolyte, air electrodes, enclosures | Iron and steel abundant; electrodes imported |
| Vanadium flow | Vanadium electrolyte, membranes, carbon felt, pumps | Electrolyte and membranes mostly imported; pumps and tanks local |
| All-iron flow | Iron salts, tanks, stacks | Materials local; stacks imported or licensed |
| Zinc batteries | Zinc, electrolytes, enclosures | Zinc produced in India |
| Carnot / sand / CO₂ | Steel, insulation, sand, heat exchangers, turbines, compressors | Strong local engineering base |
| Gravity | Concrete or composite blocks, cranes, motors, steel | Mostly local |
16.2Routes to local manufacturing
- Licensing a technology and assembling modules in India
- Joint ventures with technology owners for cell or stack lines
- Local supply of balance of plant (enclosures, tanks, PCS, transformers)
- Electrolyte production and leasing for flow batteries
- Recycling and material recovery plants
- Testing laboratories for Indian certification
Supply statements are a general 2026 picture from public information and change as factories open. BARREL works through OEM partners and does not claim any manufacturing partnership on this page.
Section 17
Testing, Certification and Commissioning
For a new technology, testing is the main source of evidence. A clear test plan — factory, site and performance — protects the owner, the lender and the supplier alike.
Where a product-specific standard does not yet exist, tests are adapted from the closest IEC standard and agreed in the contract.
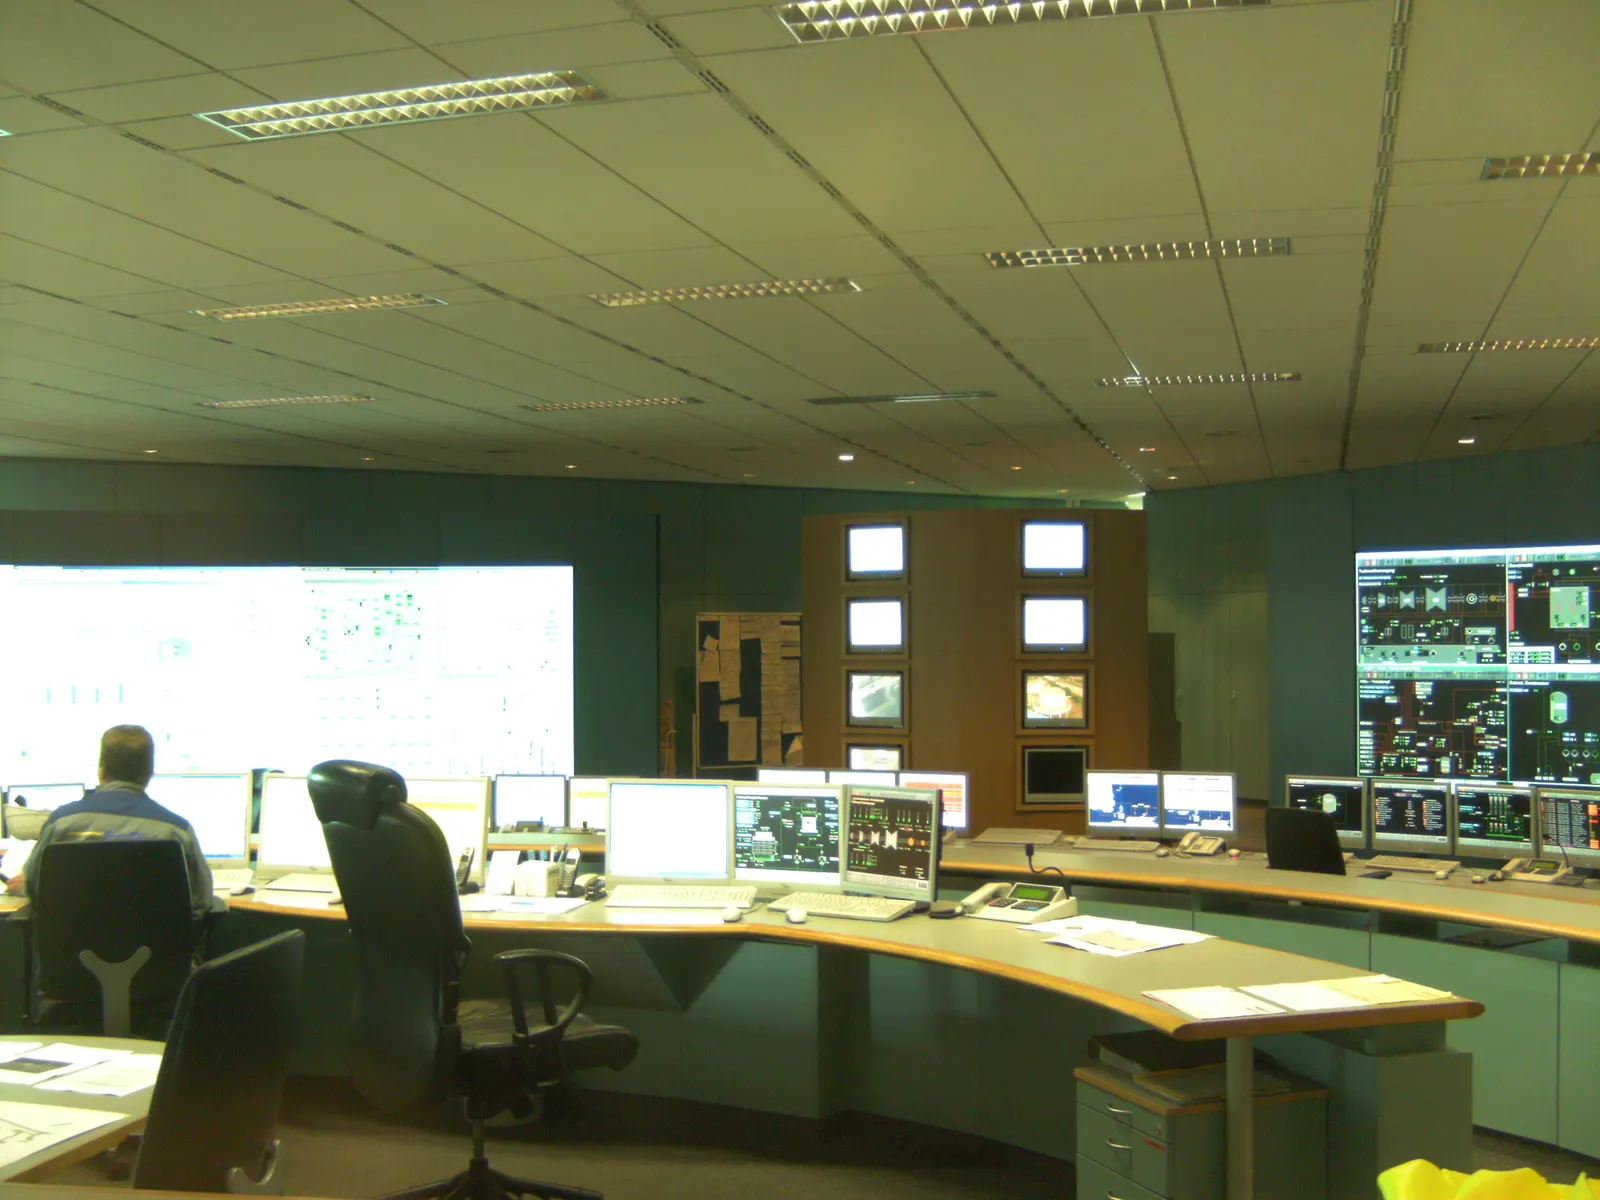
17.1Test sequence
- 1Type tests and certificates reviewed for cells, modules, stacks or machines
- 2Factory acceptance tests (FAT) witnessed for key equipment
- 3Pre-commissioning: insulation, protection, controls, auxiliaries
- 4Cold and hot commissioning (thermal and mechanical types)
- 5Grid compliance tests with the transmission or distribution utility
- 6Capacity and round-trip efficiency test at rated conditions
- 7Reliability run (often 7–30 days) before handover
- 8Annual capacity tests through the warranty period
17.2Performance guarantees usually tested
| Guarantee | Typical test |
|---|---|
| Usable energy (MWh) | Full discharge at rated power after full charge |
| Round-trip efficiency | Metered AC energy out ÷ in, including auxiliaries |
| Response and ramp | Step tests to grid-code requirements |
| Availability | Measured over each contract year |
| Self-discharge / standby loss | Energy lost over a defined idle period |
Reliability-run lengths and test frequencies are typical practice and are fixed in each contract.
Section 18
Operations, Maintenance and Digital Monitoring
New technologies need different skills from lithium-ion: pumps and membranes for flow batteries, high-temperature equipment for Carnot and liquid metal, rotating machinery for CO₂ and gravity. Early plants also need closer monitoring because there is less history to rely on.
For a first-of-a-kind plant, data is the product as much as the energy is. Good monitoring, a digital twin and AI-based dispatch turn a pilot into evidence that lenders, regulators and other buyers can trust.
18.1Main O&M tasks by technology (indicative)
| Technology | Routine tasks | Major overhaul items |
|---|---|---|
| Sodium-ion, zinc static | Cooling, inverter and BMS checks, cell balancing | Module replacement or augmentation |
| Flow batteries | Pumps, valves, leak checks, electrolyte rebalancing | Stack and membrane refurbishment |
| Iron-air | Air handling, electrolyte top-up, module checks | Electrode refurbishment (to be proven) |
| Carnot / sand | Heaters, fans, insulation, steam cycle | Turbine overhaul, heater replacement |
| CO₂ battery | Compressor, turbine, dome membrane, leak checks | Machine overhauls on standard intervals |
| Gravity | Cranes or winches, cables, brakes, motor-generators | Cable and bearing replacement |
18.2Good practice for first plants
- Supplier technical staff on site for the first year
- Critical spares held in India
- Monthly performance reports against guarantees
- Root-cause analysis for every fault
- Training of local operators from day one
- Clear end-of-warranty handover plan
18.3Digital monitoring, digital twin and AI
Measure
3- High-resolution metering at grid and DC level
- Temperatures, pressures, flows
- Auxiliary consumption
Model
3- Digital twin of the store and plant
- Degradation and state-of-health models
- Performance against guarantees
Optimise
3- AI forecasting of prices, solar and wind
- Dispatch optimisation across services
- Predictive maintenance alerts
18.4Data practice for pilots
- Owner keeps a copy of all raw data, not only supplier dashboards
- Independent data logger alongside the supplier's system
- Agreed data formats and retention in the contract
- Cyber security and remote-access controls
O&M scopes for demonstration-stage technologies are still being learnt; budgets should carry a contingency above lithium-ion norms.
Section 19
Safety, Risk and Standards
Many emerging technologies are safer than lithium-ion in one respect — no thermal runaway — but bring hazards of their own: acids, bromine, hydrogen gas, high temperatures, pressure vessels or heavy moving loads. Each needs its own hazard study.
Standards for some new technologies are still being written. Where one does not exist, the general energy-storage standards (IEC 62933 series) and the nearest product standard are used.
19.1Main hazards by technology
| Technology | Main hazards | Typical controls |
|---|---|---|
| Sodium-ion | Thermal runaway (generally milder than NMC), electrical | BMS, spacing, gas detection, UL 9540A testing |
| Iron-air, zinc | Hydrogen release, caustic electrolyte | Ventilation, hydrogen detection, containment |
| Vanadium / zinc-bromine flow | Acid or bromine spills | Bunds, leak detection, PPE, spill kits |
| Liquid metal | Molten metals at ≈ 500 °C | Sealed cells, insulation, thermal protection |
| Carnot / sand / TPV | High temperatures, burns, insulation failure | Guarding, temperature trips, hot-surface controls |
| CO₂ battery | Asphyxiation if CO₂ released, pressure vessels | CO₂ detectors, pressure safety valves, PESO approvals |
| Gravity | Falling loads, structural failure | Brakes, redundancy, structural design and inspection |
19.2Key standards (international and India)
International
7- IEC 62933 series — electrical energy storage systems
- IEC 62619 / IEC 62620 — industrial secondary lithium cells and batteries
- IEC 62932 series — flow battery systems
- IEC 62282-8 — reversible fuel cell energy storage
- UL 9540 / UL 9540A — system safety and fire propagation tests
- NFPA 855 — installation of stationary storage
- IEC 62443 — industrial cyber security
India
6- CEA technical standards for connectivity to the grid
- CEA safety and electric supply regulations
- BIS standards adopted from IEC battery standards
- PESO approvals for pressure vessels and hazardous substances
- Battery Waste Management Rules, 2022
- State fire-service NOCs and pollution-board consents
Standard numbers and editions change; the exact edition and the Indian equivalent (IS number) are confirmed for each project at design stage.
Section 20
Environment and Circularity
A large part of the case for emerging storage is environmental: abundant, low-toxicity materials, long life and easier recycling. These claims also need checking — a cheap material can still have a heavy production footprint.
20.1Circularity by technology
01
Flow batteries
Vanadium electrolyte does not wear out and can be recovered and reused almost fully; stacks and tanks are recyclable plastics and metals.
02
Sodium-ion
No cobalt or nickel; aluminium collectors on both sides simplify recycling, though recovery value is lower than for lithium cells.
03
Iron, zinc, sand
Low-toxicity, widely recycled materials; sand and rock stores are largely inert at end of life.
04
CO₂ battery
CO₂ is a closed-loop working fluid, not a store of emissions; leakage is minor but monitored.
05
Gravity
Blocks can use waste soil, mine tailings or demolition material; structures are long-lived.
06
Liquid metal, TPV
Specialist metals and cells need dedicated recovery routes still to be developed at scale.
20.2Environmental checks in BARREL studies
- Life-cycle carbon per MWh delivered, including charging losses
- Land use and visual impact (domes, towers, tanks)
- Water use for cooling or processes
- Hazardous materials inventory and spill planning
- End-of-life plan under India's Battery Waste Management Rules, 2022 (extended producer responsibility)
Section 21
Commercial Models, Costs, Revenue and Investment Risk
Emerging technologies compete in the same markets as lithium-ion and pumped storage: tenders for storage capacity, FDRE and RTC supply, peak power, ancillary services and behind-the-meter savings. Their edge is usually at longer durations, in harsh climates, or where safety or materials are decisive.
Because early plants carry technology risk, finance terms are tighter: shorter debt, higher reserves, stronger warranties. Costs fall as plants are repeated — but only if they are repeated.
21.1Indicative cost structure (public literature, 2024–2026)
| Technology | Power-related cost | Energy-related cost | Where it competes |
|---|---|---|---|
| Lithium-ion (LFP) — reference | Low | Medium | 1–4 h, daily cycling |
| Sodium-ion | Low | Medium (target below LFP) | 1–4 h, cold climates |
| Vanadium flow | High | Medium-high (vanadium-driven) | 4–12 h, heavy cycling, long life |
| Iron-air | High | Very low (target) | 50–100+ h, multi-day |
| Carnot / sand (power) | High (turbine) | Very low | 10–100 h, heat-and-power |
| CO₂ battery | Medium-high | Low | 8–24 h |
| Gravity | Medium-high | Medium (civil works) | 4–12 h |
21.2Revenue and contract models in India
Capacity contracts
3- Storage tenders paying per MW per month
- FDRE and RTC supply with storage
- Viability gap funding (VGF) for BESS
Market revenue
3- Energy arbitrage on power exchanges
- Ancillary services (secondary and tertiary reserve)
- Peak support to discoms
Behind the meter
3- Time-of-day tariff savings
- Demand charge reduction
- Back-up and resilience for critical loads
21.3Investment risks and mitigations
| Risk | Mitigation |
|---|---|
| Technology underperforms | Performance guarantees, liquidated damages, staged scale-up |
| Supplier fails or exits | Parent guarantees, escrow of designs and software, insurance-backed warranties |
| Degradation faster than claimed | Augmentation reserve, capacity tests, warranty triggers |
| Revenue shortfall at long durations | Contracts valuing firm capacity, hybrid with lithium-ion for short duty |
| Lender caution | Independent engineer, demonstration data, blended or grant finance for first plants |
| Policy change | Contracts with change-in-law clauses; diversified revenue |
Cost levels are qualitative or indicative from public studies (IEA, PNNL, NREL and others) and change quickly. Real figures come from quotes for a specific site and size.
Section 22
India and Global Markets and Policy
India plans large volumes of storage to balance its renewable build-out towards 500 GW of non-fossil capacity by 2030. Most early tenders have chosen lithium-ion and pumped storage, but tender rules are increasingly technology-neutral — any storage that meets the duty, availability and safety terms can compete.
Globally, the push for long-duration storage is led by programmes in the USA, Europe, China and Australia, which fund demonstrations and set duration-specific procurement.
22.1India — policy points relevant to emerging storage
| Instrument | What it does |
|---|---|
| National Framework for Promoting Energy Storage Systems (Ministry of Power, 2023) | Sets direction for storage procurement, market design and incentives |
| Energy Storage Obligation (Ministry of Power) | Requires obligated entities to hold a rising share of energy from storage |
| VGF scheme for battery storage | Viability gap funding for BESS capacity, first approved in 2023 and expanded in 2025 |
| PLI for advanced chemistry cells | Production incentive for cell manufacturing; chemistry-neutral |
| CEA guidelines and connectivity standards | Technical rules for connecting and operating storage |
| CERC and state regulations | Market access, ancillary services, storage as a grid asset |
| ISTS charge waiver for storage | Reduced transmission charges for qualifying storage projects (time-bound) |
22.2Global programmes to watch
01
USA
Department of Energy long-duration storage targets and demonstration funding; tax credits for stationary storage.
02
Europe
Innovation funds, national long-duration tenders and capacity markets open to storage.
03
China
Large provincial demonstration programmes for sodium-ion, flow, CO₂, gravity and compressed air.
Policy details (amounts, deadlines, waiver periods) change often; BARREL checks the current notification for every project. This table is a summary, not legal advice.
Section 23
Frequently Asked Questions and References
Short answers to the questions clients ask most about emerging storage. Readiness statements reflect 2026 and will change.
23.1Questions and answers
What is long-duration energy storage (LDES)?
Storage that can deliver its rated power for many hours — usually 8 hours or more, up to days. It helps cover evenings, nights and cloudy or windless spells.
Why not just use more lithium-ion batteries?
For 1–4 hours lithium-ion is usually cheapest. For longer durations, every extra hour costs a full set of cells, so technologies with cheap energy storage (tanks, iron, sand) can become cheaper.
Is sodium-ion ready for grid projects?
It is early commercial as of 2026: grid plants of around 100 MWh are operating, mainly in China. Field history is short, so warranties and supplier strength need careful review.
What does TRL mean?
Technology Readiness Level, a 1–9 scale from basic research (1) to proven, repeated commercial use (9). BARREL combines it with commercial and manufacturing readiness.
How long can an iron-air battery discharge?
Designs aim at about 100 hours at rated power. Its round-trip efficiency is lower (about 35–50%), so it suits multi-day back-up rather than daily cycling.
Are flow batteries an emerging technology?
Vanadium flow is established, with plants of hundreds of MWh. All-iron, zinc-bromine and organic flow batteries are newer and at earlier readiness.
What is a Carnot battery?
A store that converts electricity to heat, keeps the heat in cheap material, and turns it back to electricity with a heat engine. Selling the heat directly is often more efficient.
Does a CO₂ battery release carbon dioxide?
No. The CO₂ circulates in a closed loop and is only the working fluid. It does not capture or store emissions either.
Are gravity storage systems efficient?
Developers claim 75–85% for block systems and higher for shaft systems. Few large plants have long operating records yet.
Which emerging technologies are safest?
Water-based chemistries (iron-air, flow, zinc) and thermal or mechanical stores have no thermal runaway, but each has its own hazards — acids, hydrogen, heat or heavy loads — that need a hazard study.
Can these technologies take part in Indian tenders?
Many recent storage tenders are technology-neutral if the bidder meets duty, availability and safety terms. Some schemes are specific to battery storage, so eligibility must be checked for each tender.
What efficiency should I expect?
Roughly: lithium-ion 85–90%, flow 60–75%, CO₂ and gravity 70–85% (claims), Carnot 30–60%, iron-air 35–50%, hydrogen-based routes 30–45%. All are AC-to-AC indicative ranges.
How big should a pilot be?
Large enough to be representative of the full plant — often 100 kW to a few MW — and run for at least one full year to cover Indian summer and monsoon.
Who carries the risk if a new technology underperforms?
It should be shared through performance guarantees, liquidated damages, parent guarantees and staged scale-up. BARREL helps structure these terms.
Can India manufacture these technologies?
Many use materials and equipment India already makes (steel, iron, zinc, sand, turbines, pumps). Cell and stack manufacturing is at an early stage and usually starts through licensing or joint ventures.
When will a technology be ready for my project?
When it has operating plants at a similar size and duty, a warranty backed by a strong balance sheet, and costs that beat alternatives for your duration. BARREL's readiness tracker is reviewed regularly against these tests.
Does BARREL make any of these technologies?
No. BARREL is a project developer and EPC company; it works with technology owners and OEM partners, and offers independent due diligence, pilots and scale-up projects.
23.2Useful references
- International Energy Agency (IEA)Energy storage and grid outlooks
- IRENARenewables and storage cost studies
- US Department of EnergyLong-duration storage programmes
- NREL — Energy StorageStorage research and cost data
- Pacific Northwest National LaboratoryStorage cost and performance assessments
- EPRIUtility storage research and safety
- Central Electricity Authority (CEA)Indian grid standards and plans
- Ministry of New and Renewable Energy (MNRE)Indian renewable and storage policy
- IEC WebstoreIEC 62933, 62619, 62932 standards
- Technology readiness level (Wikipedia)Background on the TRL scale
Answers give indicative, general information as of 2026 and are not investment or legal advice.
Section 24
BARREL Services for Emerging Storage
From watching a technology to building its first plants in India. BARREL works through OEM and technology partners and as an independent adviser; it does not manufacture storage technologies.
24.1What BARREL can do
01
Technology watch
Regular briefings on readiness, pilots and costs for your use case.
02
Due diligence
Independent technical and commercial review of a technology or a supplier, for owners and investors.
03
Feasibility and LCOS
Duty study, technology comparison and cost of storage against lithium-ion and pumped storage.
04
Pilot projects
Design, site, install and monitor a pilot with clear success tests and independent data.
05
Partnerships for India
Help technology owners with licensing, assembly and manufacturing routes, and with Indian certification.
06
Scale-up EPC
Move proven technologies into full-size projects, as EPC contractor or owner's engineer.
07
Hybrid plant design
Combine an emerging long-duration store with solar, wind and lithium-ion for FDRE and RTC supply.
08
O&M support
Operation, monitoring and performance reporting for first plants.
09
Research links
Work with institutes and universities on testing and standards.
24.2How an engagement starts
- Tell us the technology or the duty you need
- Short call and data request
- Readiness and fit note
- Proposal for diligence, pilot or project
Project desk
Explore emerging storage with BARREL
Pilot today what the grid will need tomorrow.
A technology developer looking for India partners, a utility or industry planning a pilot, or an investor doing due diligence — tell us the technology and your goal, and we will respond with the next steps.
Project categories
- Sodium-ion
- Iron-air
- Flow batteries
- Carnot / sand / CO₂
- Solid-state
- Metal fuels