
- Energy Storage
- Family 05
- Chemical
- Seasonal
- Power-to-X
Chemical Energy Storage
Hydrogen | Ammonia | Methanol | Synthetic Fuels | LOHC | Metal Carriers | Back-to-Power
Electricity turned into molecules you can keep for months.
Chemical storage converts electricity into a fuel — hydrogen, ammonia, methanol or synthetic gas — that can be kept in tanks or underground caverns, shipped across oceans and turned back into power, heat or industrial feedstock. It is the main route to storing energy for weeks and seasons, not just hours. BARREL develops, engineers and builds the full chain: electrolyser, compression, storage, conversion to carriers and back-to-power, through OEM partners and its own engineering teams.
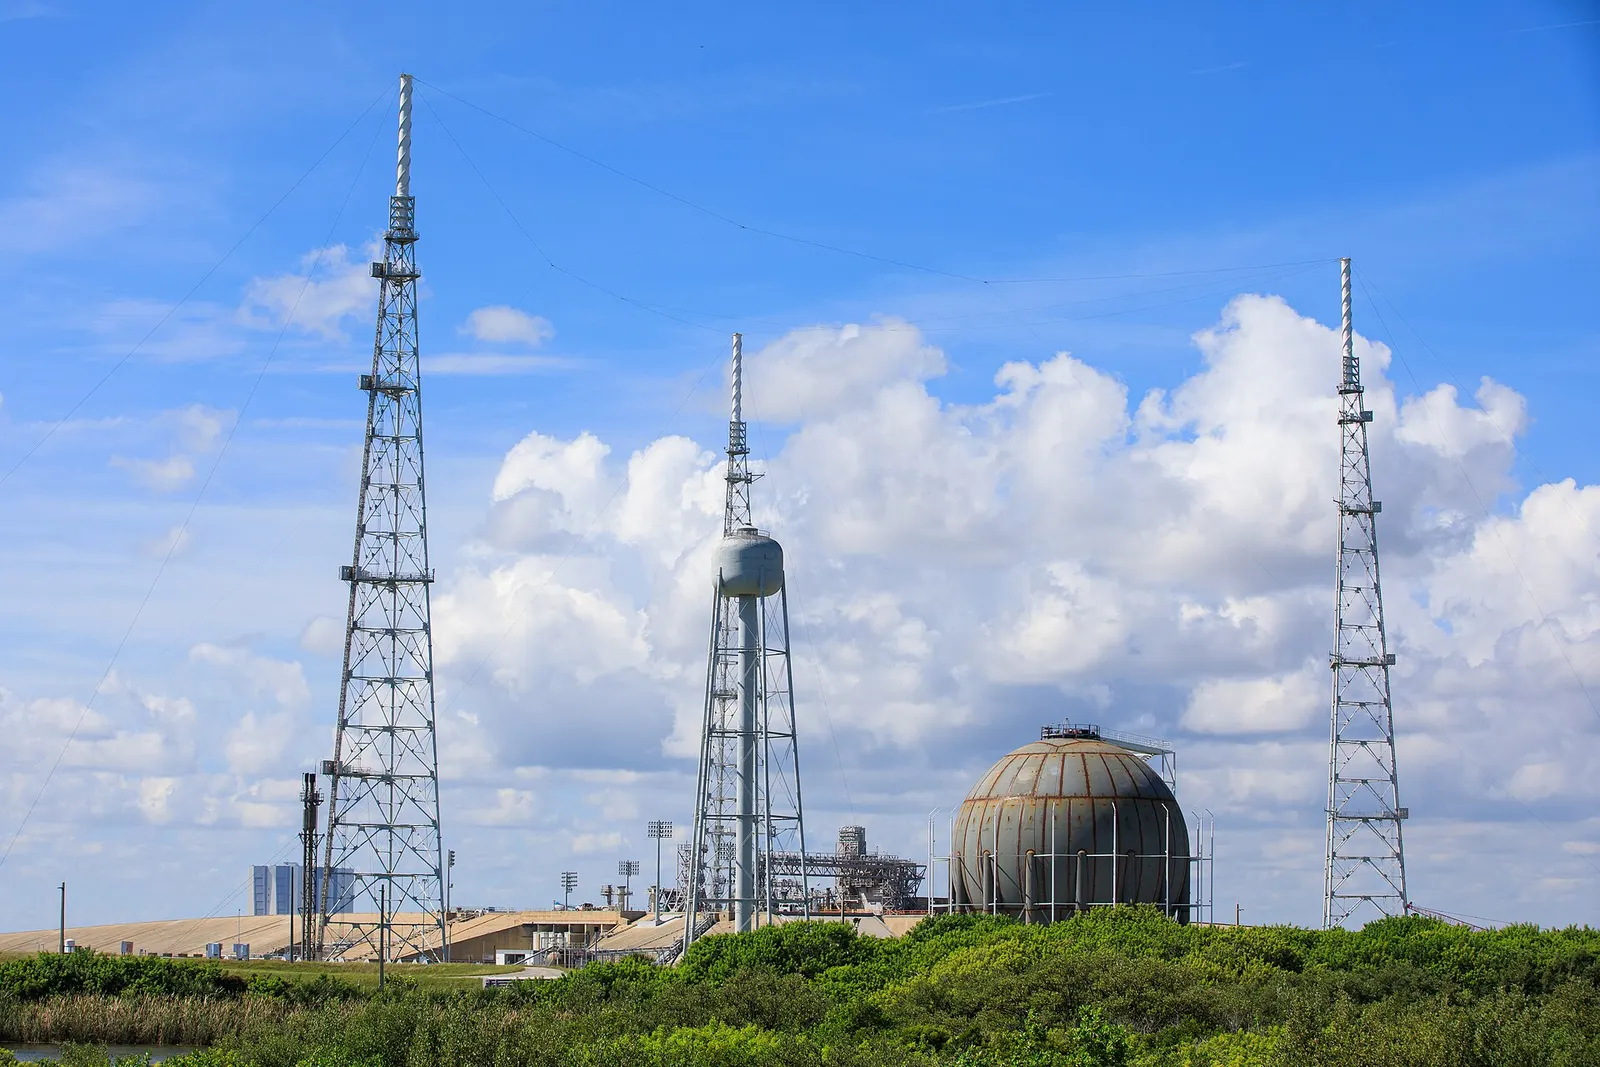
CConvert
Electrolysis and synthesis
SStore
Tanks, caverns, carriers
RReturn
Power, heat or feedstock
- Duration range
- Days–seasons
- H₂ energy (LHV)
- 33.3 kWh/kg
- Power-to-power efficiency
- 30–40 %
- Plant range
- MW–GW
- Power, fuel, feedstock
- Multi-use
Section 01
Chemical Storage — Overview
Chemical storage keeps energy in chemical bonds. Electricity splits water into hydrogen and oxygen; the hydrogen can be stored as it is, or combined with nitrogen (to make ammonia) or with carbon dioxide (to make methanol, methane or liquid e-fuels) into carriers that are easier to store and move.
Its round-trip efficiency is lower than a battery's, but the stored energy costs very little to keep, does not leak away over the months and can also be sold outside the power sector — as fertiliser, shipping fuel or refinery feedstock. That is why it is the leading option for seasonal storage and for moving renewable energy between countries.
This page is the storage view: how the energy goes in, how it is held and how it comes back. The production, offtake and export side of green hydrogen and its derivatives is covered in depth on the Green Hydrogen hub at /sectors/green-h2.
1.1Energy carriers compared
| Carrier | How it is stored | Energy (LHV) | Main uses |
|---|---|---|---|
| Hydrogen (compressed) | 30–700 bar steel or composite vessels, tube trailers | 33.3 kWh/kg | Power, mobility, industry |
| Hydrogen (liquid) | −253 °C vacuum-insulated tanks | 33.3 kWh/kg | Long-distance transport, aerospace |
| Hydrogen (salt cavern) | Underground cavern, roughly 60–180 bar | 33.3 kWh/kg | Seasonal and strategic storage |
| Ammonia (NH₃) | −33 °C refrigerated or ~10 bar pressurised tanks | 5.2 kWh/kg | Fertiliser, shipping fuel, H₂ carrier, co-firing |
| Methanol (CH₃OH) | Ordinary atmospheric liquid tanks | 5.5 kWh/kg | Chemicals, shipping fuel, blending |
| Synthetic methane (CH₄) | Gas grid, cavern or LNG tanks | 13.9 kWh/kg | Gas grid, power, heat |
| LOHC (e.g. dibenzyltoluene) | Diesel-like liquid at ambient conditions | ≈2 kWh per kg of carrier | Transport and storage of H₂ |
1.2Why chemical storage
01
Very long duration
Holds energy for weeks or months with almost no standing loss — batteries cannot do this economically.
02
Cheap to scale energy
Adding a bigger tank or cavern is far cheaper per MWh than adding more battery cells.
03
Moves across oceans
Ammonia and methanol ship in existing tankers, so renewable energy can be exported.
04
Many buyers
The same molecule can be sold to power, fertiliser, steel, refining or shipping.
1.3Strengths and limits in plain words
Strengths
4- Seasonal storage at low cost per stored MWh
- Power and energy sized separately
- Uses existing gas, chemical and shipping know-how
- Decarbonises sectors electricity cannot reach directly
Limits
4- Power-to-power efficiency of roughly 30–40 %
- High capital cost of electrolysers today
- Needs careful safety design and licences
- Supply chains in India are still being built up
Energy values are standard lower-heating-value (LHV) figures. Efficiencies and pressures are typical ranges from public literature and depend on technology, size and operating pattern.
Section 02
How Chemical Storage Works
Every chemical store has three stages: charge (electricity makes a fuel), hold (the fuel is kept) and discharge (the fuel makes electricity, heat or a product). Unlike a battery, the three stages are separate machines, so each can be sized on its own.
The electrolyser sets the charging power (MW), the tank or cavern sets the stored energy (MWh or tonnes) and the fuel cell or turbine sets the discharge power. A plant can charge slowly for months and discharge quickly for days.
2.1The power-to-power chain
- Surplus solar / wind
- Electrolyser (H₂O → H₂ + ½O₂)
- Compression or conversion
- Tank, cavern or carrier
- Fuel cell / turbine / engine
- Electricity back to grid
2.2Key reactions
| Step | Reaction | Typical conditions |
|---|---|---|
| Water electrolysis | 2H₂O → 2H₂ + O₂ | 60–90 °C (AWE/PEM), 700–850 °C (SOEC) |
| Ammonia synthesis (Haber-Bosch) | N₂ + 3H₂ → 2NH₃ | 150–300 bar, 400–500 °C, iron catalyst |
| Methanol synthesis | CO₂ + 3H₂ → CH₃OH + H₂O | 50–100 bar, 200–300 °C, copper-zinc catalyst |
| Methanation (Sabatier) | CO₂ + 4H₂ → CH₄ + 2H₂O | 300–450 °C, nickel catalyst |
| Ammonia cracking | 2NH₃ → N₂ + 3H₂ | Roughly 500–900 °C with catalyst |
| Fuel cell | 2H₂ + O₂ → 2H₂O + electricity + heat | 60–80 °C (PEM) to 600–800 °C (SOFC) |
2.3Three things sized separately
01
MW inCharge power
Electrolyser MW — chosen from the surplus renewable profile and how many hours a day it can run.
02
MWh heldStored energy
Tonnes of hydrogen or carrier — chosen from how many days or weeks of supply are needed.
03
MW outDischarge power
Fuel cell, turbine or engine MW — chosen from the load or grid commitment during deficit periods.
2.4Where the energy goes
- Electrolysis: about 30–40 % lost as heat (can be recovered)
- Compression to 200–500 bar: roughly 2–4 % of the hydrogen energy
- Liquefaction: roughly 25–35 % of the hydrogen energy today
- Carrier synthesis (ammonia, methanol): a further 10–20 %
- Cracking or dehydrogenation: heat equal to roughly 15–30 % of the energy
- Conversion to power: 40–60 % efficient, rest as heat
Section 03
Charging the Store — Electrolysers
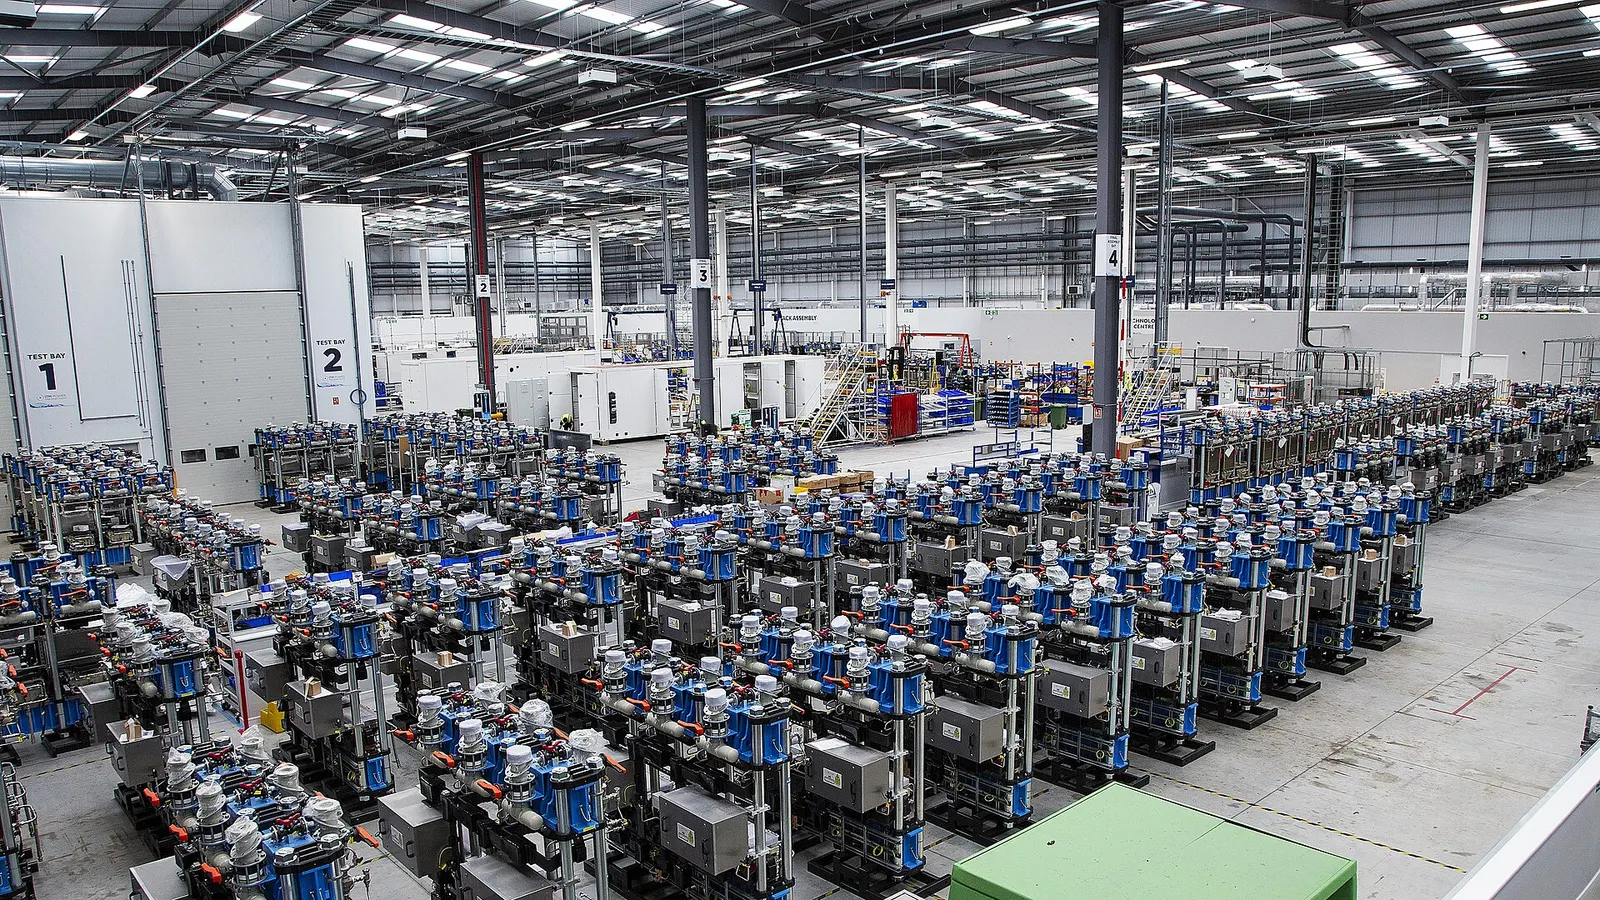
The first machine of every chemical store is an electrolyser powered by renewable or surplus electricity. Four families exist; alkaline and PEM are the ones bought at scale today.
For storage duty the key questions are how well the electrolyser follows variable solar and wind, how fast it starts, how low it can turn down and how quickly its stack wears under cycling.
3.1Electrolyser technologies
| Type | Maturity | System energy | Load following | Watch-out |
|---|---|---|---|---|
| Alkaline (AWE) | Commercial, largest plants | ≈50–55 kWh/kg | Turn-down ≈15–20 %, slower response | Larger footprint, caustic electrolyte |
| PEM | Commercial | ≈50–57 kWh/kg | Fast (seconds), wide range | Platinum-group metals, iridium supply |
| Solid oxide (SOEC) | Early commercial | ≈40–45 kWh/kg + heat | Best at steady load | 700–850 °C, stack degradation |
| Anion exchange (AEM) | Emerging | ≈50–55 kWh/kg | Fast, small units | Membrane life still being proven |
3.2Electricity per kilogram
Electrolyser output
H₂ (kg) = E (kWh) ÷ SEC
10 MW × 1 h = 10,000 kWh ÷ 52 kWh/kg ≈ 190 kg H₂
The theoretical minimum is about 39.4 kWh/kg (hydrogen's higher heating value). Real plants use about 50–55 kWh/kg at system level including rectifiers, pumps, cooling and purification; the figure rises slowly as stacks age.
| Symbol | Meaning |
|---|---|
| E | Electricity supplied (kWh) |
| SEC | Specific energy consumption (kWh/kg) |
3.3What sits around the stack
Electrical
4- Transformer and rectifier (AC to DC)
- Harmonic filters
- Auxiliary supply and UPS
- Stack DC busbars
Process
4- Water treatment (RO, demineralisation)
- Gas-liquid separators
- Deoxo and dryer for purity
- Lye or water circulation pumps
Utilities
4- Cooling (dry coolers or towers)
- Nitrogen for purging
- Instrument air
- Oxygen venting or recovery
3.4Resources per kilogram of hydrogen
- Electricity: about 50–55 kWh
- Pure water: 9 kg by chemistry; about 10–15 litres of raw water after treatment losses
- Cooling water: more if wet cooling towers are used
- By-product oxygen: about 8 kg — can be sold to hospitals or industry
Energy and water figures are indicative ranges from IEA and IRENA publications and vary with technology, stack age, cooling method and water quality. Detailed production economics are on the Green Hydrogen hub (/sectors/green-h2).
Section 04
Storing Hydrogen above Ground — Compressed and Liquid
Hydrogen is the lightest gas: a cubic metre at normal conditions weighs only about 90 grams. To store useful amounts it must be squeezed to high pressure or cooled to a liquid at −253 °C.
For stores up to a few tens of tonnes, compressed-gas vessels are the usual answer. Liquid hydrogen is denser but costs a lot of energy to make and slowly boils off, so it suits transport and large hubs rather than long-term static storage.
4.1How much hydrogen fits in a cubic metre
| Form | Approx. density | Energy (LHV) per m³ | Typical use |
|---|---|---|---|
| Gas at 1 bar, 15 °C | ≈0.085 kg/m³ | ≈0.003 MWh | Pipelines (before compression) |
| Compressed, 30–50 bar | ≈2.5–4 kg/m³ | ≈0.08–0.13 MWh | Buffer tanks after electrolyser |
| Compressed, 200 bar | ≈15 kg/m³ | ≈0.5 MWh | Tube trailers, bulk stores |
| Compressed, 350 bar | ≈24 kg/m³ | ≈0.8 MWh | Buses, trucks |
| Compressed, 700 bar | ≈40 kg/m³ | ≈1.3 MWh | Cars, compact stores |
| Liquid, −253 °C | ≈71 kg/m³ | ≈2.4 MWh | Large tanks, shipping, aerospace |
4.2Pressure-vessel types
Type I and II
4- Type I: all-steel, cheapest, heaviest
- Type II: steel liner with hoop-wound fibre
- Used for stationary bulk banks
- Watch steel grade for hydrogen embrittlement
Type III and IV
4- Type III: aluminium liner, full carbon-fibre wrap
- Type IV: polymer liner, full carbon-fibre wrap
- Light; used for vehicles and trailers
- Higher cost per kg stored
4.3Liquid hydrogen in practice
01
Liquefaction energy
Today's plants use roughly 10–13 kWh per kg — about a third of the hydrogen's energy. Larger, newer plants aim for 6–8 kWh/kg.
02
Boil-off
Heat leaking in boils off roughly 0.1–1 % per day depending on tank size; large spheres lose the least.
03
Spherical tanks
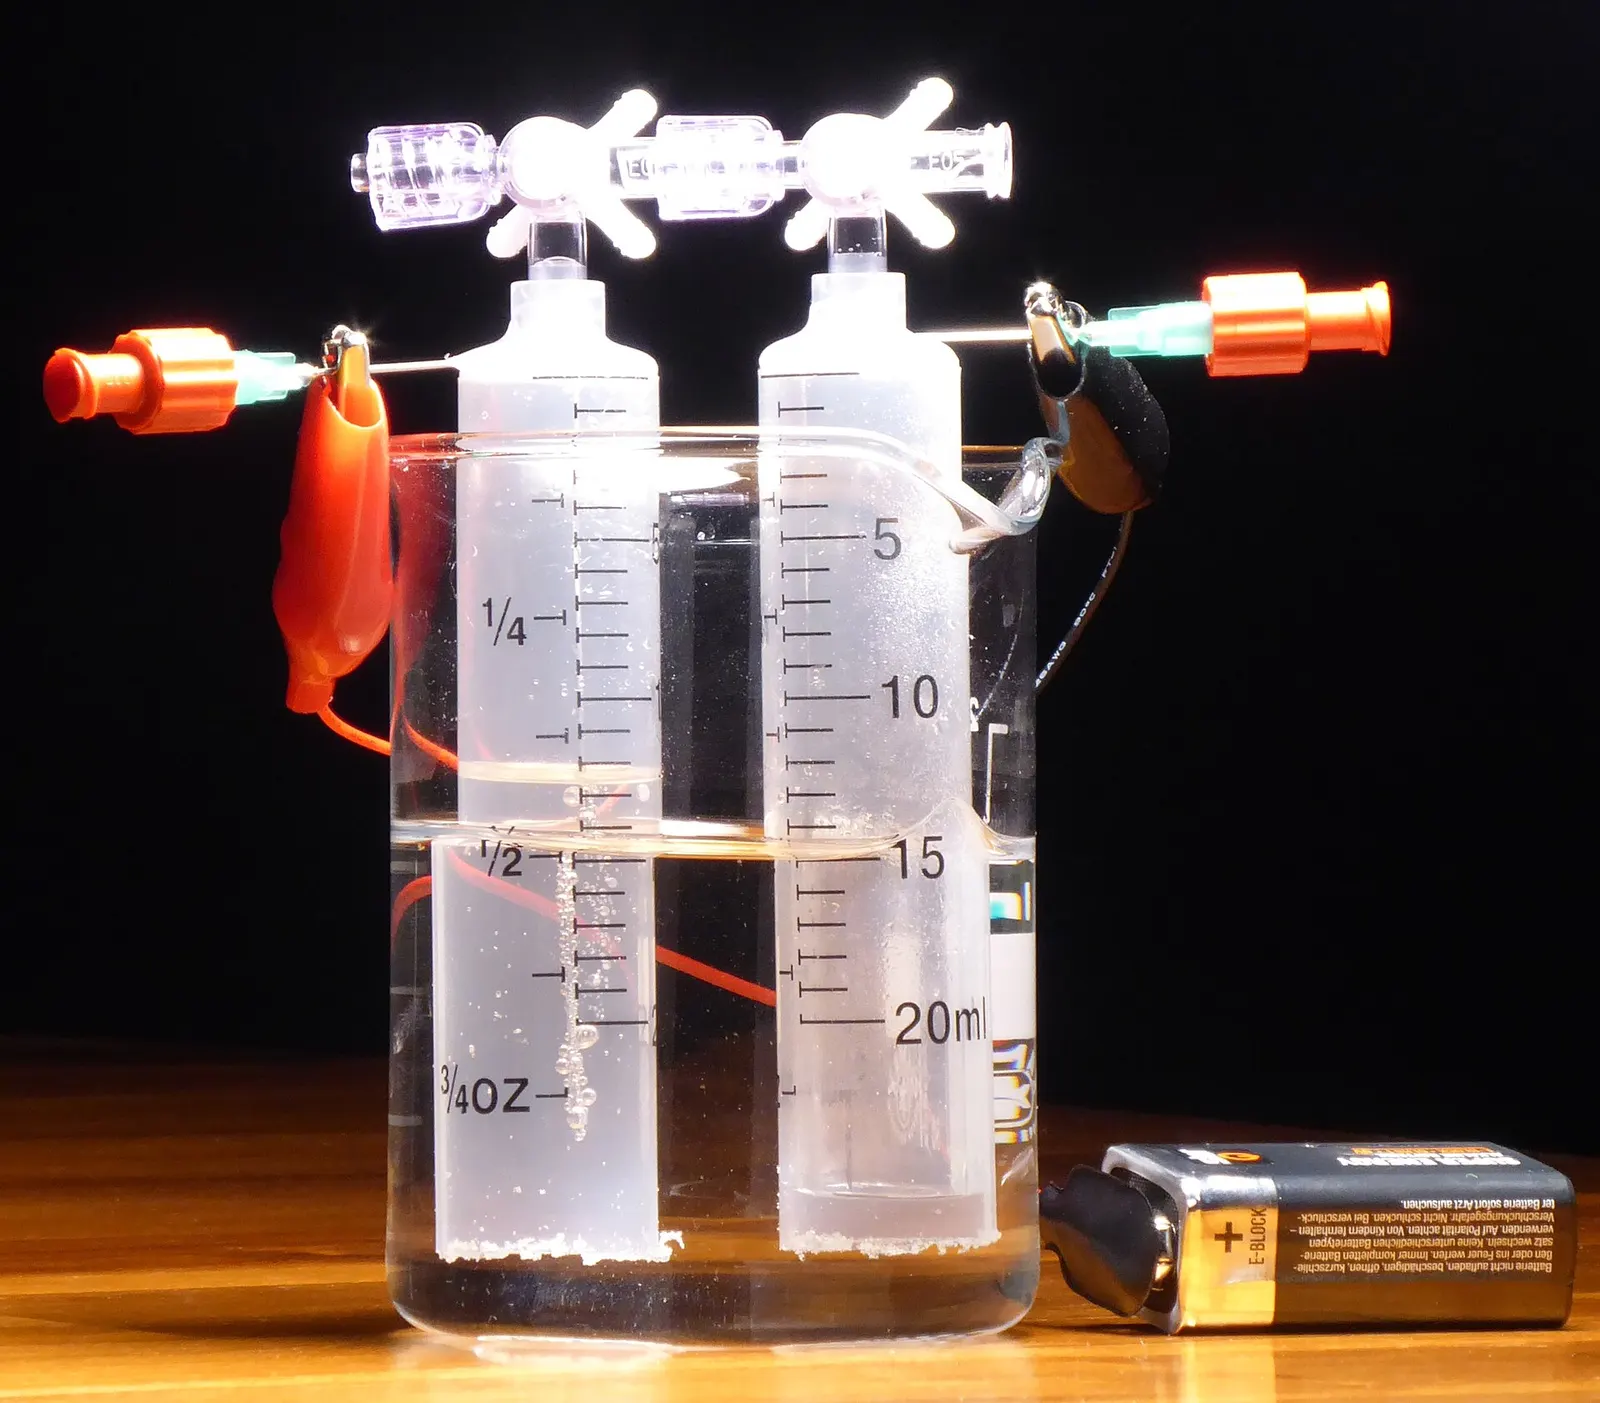
Large vacuum-insulated spheres, such as those at space launch sites, hold several thousand cubic metres.
4.4Vessel volume for a given mass
Water volume needed
V (m³) = m (kg) ÷ (ρ(Pmax) − ρ(Pmin))
2,000 kg usable between 200 and 30 bar: 2,000 ÷ (15 − 2.5) ≈ 160 m³
Not all the gas can be taken out: the vessel must stay above the minimum pressure the compressor or fuel cell needs. Densities come from real-gas tables (hydrogen is about 10–15 % less dense than the ideal-gas law predicts at 200 bar).
| Symbol | Meaning |
|---|---|
| m | Usable hydrogen (kg) |
| ρ | Hydrogen density at the stated pressure (kg/m³) |
4.5Reference installations
Densities are approximate real-gas values at about 15 °C; liquefaction and boil-off figures are typical published ranges and depend strongly on plant and tank size.
Section 05
Storing Hydrogen Underground
For seasonal storage of hundreds or thousands of tonnes, steel vessels become too expensive. The answer is geology: caverns leached out of thick salt layers have stored hydrogen safely for decades.
Salt caverns in Teesside, UK (operating since the 1970s) and on the US Gulf Coast (Clemens Dome since 1983, later Moss Bluff and Spindletop) store hydrogen for the chemical industry. Other geological options are being studied. The full geology, cavern design and a cavern calculator are on BARREL's Underground Storage page.
5.1Underground options for hydrogen
| Option | Status for hydrogen | Size | Notes |
|---|---|---|---|
| Salt cavern | Proven (UK, USA) | Hundreds to several thousand tonnes per cavern | Salt is gas-tight and does not react; fast cycling possible |
| Lined rock cavern | Demonstration | Tens to hundreds of tonnes | Steel-lined cavern in hard rock; useful where no salt exists |
| Depleted gas field | Research and pilots | Very large | Risk of mixing, microbial reactions and gas loss |
| Aquifer | Research | Very large | Least understood; cushion gas needs high |
5.2A cavern storage cycle
- Electrolyser output
- Compressor to cavern pressure
- Injection through wellhead
- Storage (months)
- Withdrawal
- Drying and purification
- Pressure reduction to user
5.3Words you will hear
- Working gas — the hydrogen you can take out and use
- Cushion gas — gas left in to keep the cavern stable (often 25–35 % of the total)
- Pressure window — the safe minimum and maximum set by depth and rock strength
- Leaching — dissolving salt with water to form the cavern; brine must be disposed of
India's known thick salt deposits are limited (studies have looked at Rajasthan), so most Indian projects will rely on above-ground vessels, carriers such as ammonia, or lined rock caverns. For cavern sizing use the estimator on the Underground Storage page (/energy-storage/underground-storage).
Section 06
Green Ammonia — Hydrogen in a Liquid That Ships
Ammonia (NH₃) is made from hydrogen and nitrogen taken from the air. It turns into a liquid at −33 °C or at about 8–10 bar at room temperature — far easier than liquid hydrogen. The world already makes and ships about 180–190 million tonnes a year, mostly for fertiliser, so tanks, ships and safety rules exist.
As a store it holds about 1.5 times more hydrogen per cubic metre than liquid hydrogen. It can be burned directly in engines, turbines and boilers, or cracked back into hydrogen.
6.1Green ammonia chain
- Renewable power
- Electrolyser (H₂)
- Air separation (N₂)
- Hydrogen buffer
- Haber-Bosch loop
- Refrigerated tank (−33 °C)
- Ship, fertiliser, fuel or cracker
6.2Ammonia key figures
| Property | Typical value |
|---|---|
| Hydrogen content | 17.6 % by weight |
| Energy (LHV) | ≈5.2 kWh/kg (18.6 MJ/kg) |
| Liquid density at −33 °C | ≈680 kg/m³ |
| Hydrogen per m³ of liquid | ≈120 kg (vs ≈71 kg for liquid H₂) |
| Hydrogen per tonne of NH₃ | ≈0.18 t |
| Electricity per tonne (green) | ≈9.5–11 MWh incl. electrolysis, air separation, synthesis |
| Large refrigerated tanks | 10,000–50,000 t each |
6.3Ways ammonia returns energy
01
Co-firing
Blended into coal boilers; a 20 % co-firing trial ran on a 1 GW Japanese coal unit in 2024.
02
Gas turbines
Small and medium turbines burning ammonia are being developed; NOx control is the main task.
03
Engines
Marine two-stroke and power-plant engines for ammonia are entering service.
04
Cracking
Heated with a catalyst to release hydrogen for fuel cells — costs about 15–25 % of the energy.
6.4What needs care
- Toxic: leaks must be detected early; emergency planning off-site
- Corrodes copper and zinc alloys — material selection matters
- Burns slowly and makes NOx — combustion design and SCR
- Haber-Bosch prefers steady load — hydrogen buffer needed with solar and wind
Figures are indicative from public literature (IEA Ammonia Technology Roadmap, IRENA). Electricity per tonne depends on electrolyser efficiency and plant design.
Section 07
Methanol, Synthetic Methane and Liquid e-Fuels
Combining green hydrogen with captured or biogenic CO₂ gives carbon-based fuels that behave exactly like today's fuels. Methanol is a liquid at room temperature and is stored in ordinary tanks; synthetic methane can go straight into the gas grid; e-kerosene and e-diesel suit aviation and heavy transport.
The catch is the CO₂: it must come from a sustainable source (biogas, biomass, unavoidable industrial emissions or, later, direct air capture) for the fuel to count as low-carbon.
7.1e-Methanol chain
- Green hydrogen
- CO₂ capture and clean-up
- Compression to 50–100 bar
- Synthesis reactor
- Distillation
- Atmospheric tank
- Fuel, chemicals or back-to-power
7.2Carbon-based e-fuels compared
| Fuel | Inputs per tonne (approx.) | Energy (LHV) | Storage |
|---|---|---|---|
| e-Methanol | ≈0.19 t H₂ + ≈1.4 t CO₂ | ≈5.5 kWh/kg | Ambient liquid tanks, like petrol |
| e-Methane (SNG) | ≈0.5 t H₂ + ≈2.75 t CO₂ | ≈13.9 kWh/kg | Gas grid, caverns, LNG |
| e-Kerosene / e-diesel (Fischer-Tropsch) | ≈0.4–0.5 t H₂ + ≈3–3.5 t CO₂ | ≈12 kWh/kg | Ordinary fuel tanks |
7.3Where the CO₂ comes from
Biogenic
3- Compressed biogas upgrading
- Ethanol fermentation
- Biomass boilers
Best for low-carbon rating
Industrial
3- Cement kilns
- Steel and refinery off-gas
- Fertiliser plants
Rules on counting vary by market
Direct air capture
3- Fans and sorbents
- Very energy-hungry today
- Long-term option
Early stage, high cost
7.4Why methanol is easy to store
- Liquid from −97 °C to 65 °C — no pressure or refrigeration
- Uses standard tank farms, pipelines and road tankers
- Can be reformed back to hydrogen at about 250–300 °C
- Care: toxic, flash point about 11 °C and a near-invisible flame
Input ratios follow from the chemistry and are rounded; real plants need slightly more hydrogen and CO₂ to cover purge and side reactions.
Section 08
LOHC, Metal Hydrides and Metal Fuels
Some carriers hold hydrogen without turning it into a new fuel. Liquid organic hydrogen carriers (LOHC) are oils that soak up hydrogen in one reactor and give it back in another; metal hydrides absorb hydrogen like a sponge; and metals such as iron can be burned for heat and then regenerated with hydrogen.
These are less mature than ammonia and methanol, but they avoid high pressure, very low temperature or toxicity, which makes them interesting for safe storage near people.
8.1Carrier options compared
| Carrier | H₂ by weight | Release conditions | Maturity |
|---|---|---|---|
| Dibenzyltoluene (LOHC) | ≈6.2 % | 250–320 °C, catalyst, heat ≈ 25–35 % of the H₂ energy | Demonstration |
| Toluene / methylcyclohexane (LOHC) | ≈6.1 % | ≈300–350 °C, catalyst | Shipped in a 2020 Brunei–Japan demonstration |
| Room-temperature metal hydrides (e.g. LaNi₅, TiFe) | ≈1–2 % | Near ambient, low pressure | Commercial in niches (submarines, backup) |
| Magnesium hydride | ≈7.6 % | ≈300 °C | Research and pilots |
| Iron powder (metal fuel) | Not a H₂ store — burned for heat | Iron oxide regenerated with H₂ | Industrial pilots in Europe |
8.2LOHC loop
- Green H₂
- Hydrogenation reactor (releases heat)
- Loaded oil stored in ordinary tanks
- Truck / ship / pipeline
- Dehydrogenation (needs heat)
- Pure H₂ to user
- Unloaded oil returns
8.3Where they fit
01
LOHC
Long-distance transport and storage with existing fuel logistics; best where waste heat is available to release the hydrogen.
02
Metal hydrides
Compact, low-pressure stores for backup power, buildings, forklifts and sites where high pressure is not allowed.
03
Metal fuels
High-temperature heat for industry (boilers, kilns) with a recyclable fuel.
Weight percentages are theoretical carrier capacities; practical system values are lower once tanks, reactors and heat exchangers are counted.
Section 09
Turning Stored Fuel Back into Power
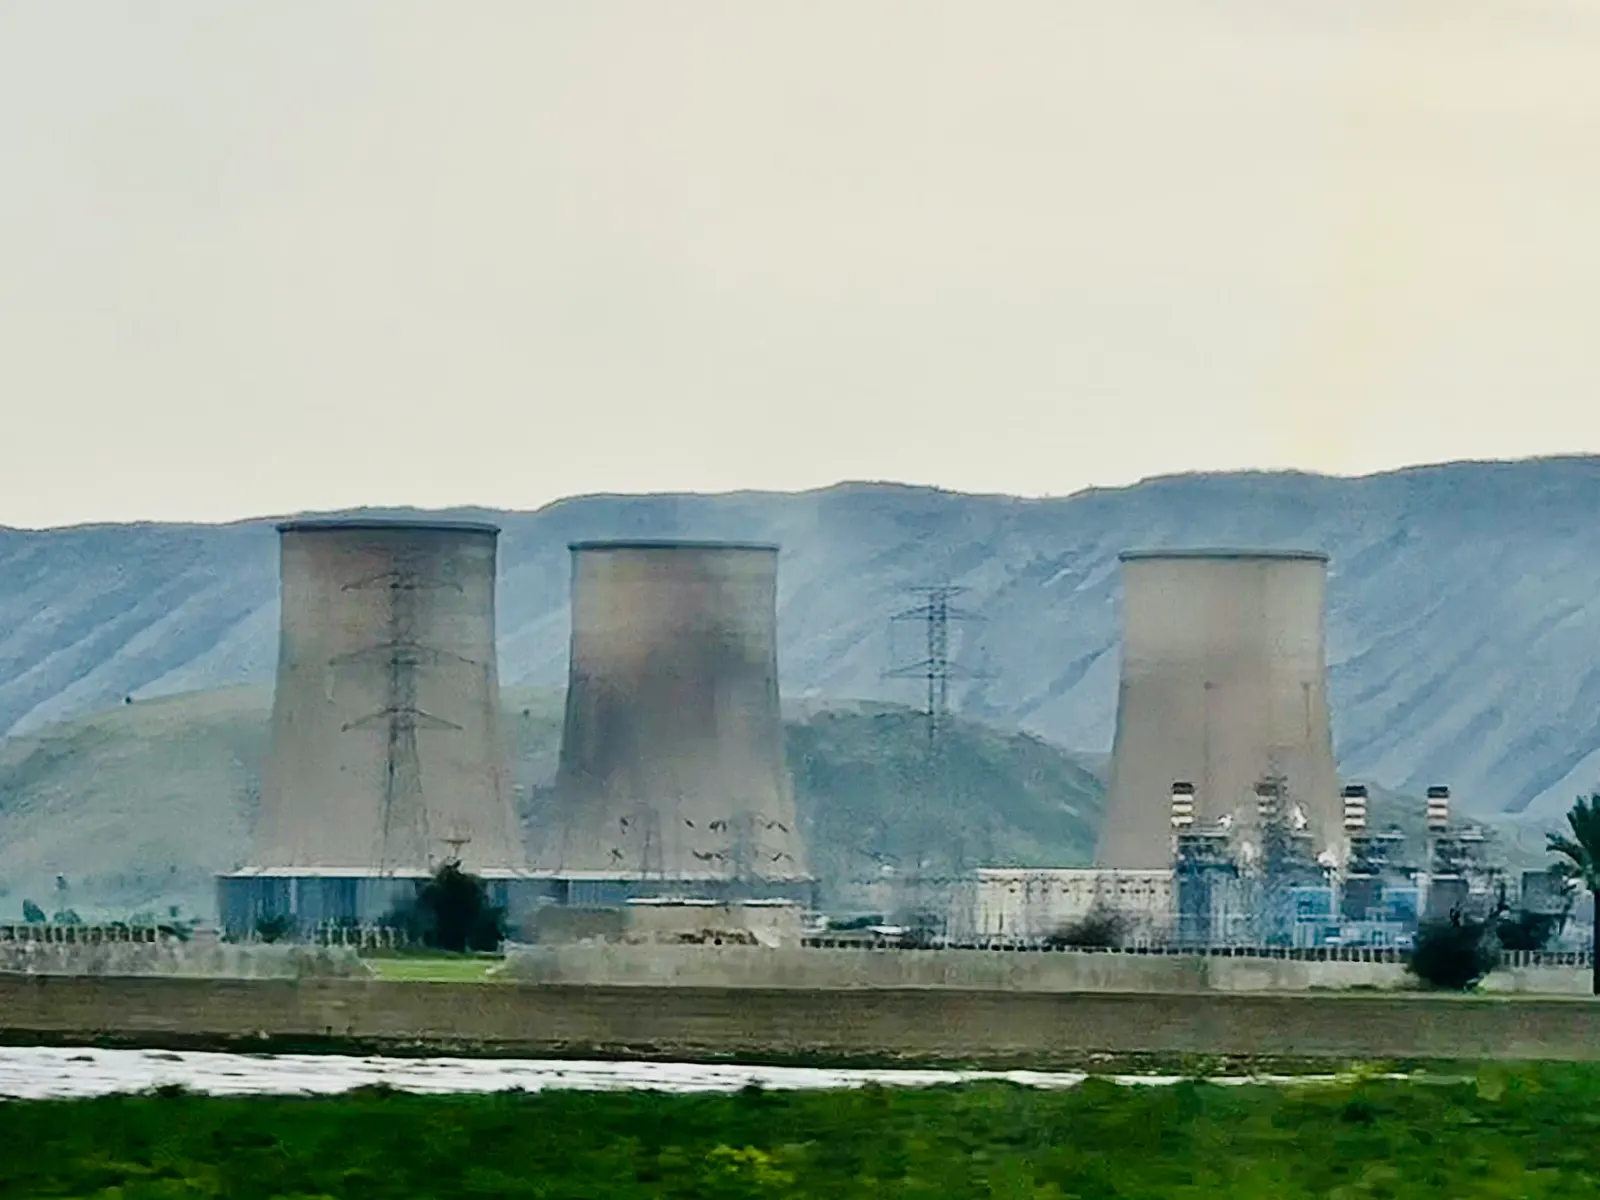
Stored chemical energy returns to the grid through fuel cells, hydrogen-capable gas turbines, reciprocating engines or co-firing in existing plants. The choice depends on size, running hours and whether the waste heat can be used.
Gas turbines and engines are cheapest per MW for rare, short peaks. Fuel cells are more efficient, quiet and modular, and suit sites that run often or need clean, local power.
9.1Conversion routes
| Route | Size range | Electric efficiency (LHV) | Fuel | Notes |
|---|---|---|---|---|
| PEM fuel cell | kW – tens of MW | ≈45–60 % | Pure H₂ | Fast start, needs high purity |
| Solid oxide fuel cell (SOFC) | kW – MW | ≈50–65 % | H₂, methane, ammonia (some designs) | High temperature, useful heat |
| Phosphoric acid fuel cell | 100 kW – MW | ≈40–45 % | H₂ | Long track record in CHP |
| Gas turbine, open cycle | 5 – 400 MW | ≈30–40 % | H₂ blends; 100 % in development | Fast peaking |
| Gas turbine, combined cycle | 50 – 600+ MW | ≈55–60 % | H₂ blends | Best for long runs |
| Reciprocating engine | 1 – 20 MW per unit | ≈40–45 % | H₂, ammonia blends | Modular captive and peaking |
9.2Power-to-power efficiency
Round trip
η = η(electrolyser) × η(storage) × η(conversion)
0.64 × 0.95 × 0.55 ≈ 33 %
An electrolyser at 52 kWh/kg turns 64 % of the electricity into hydrogen energy (33.3 ÷ 52). Compression and storage lose a few per cent; a fuel cell or combined-cycle turbine returns about half. Using the waste heat raises the useful total to 60–80 %.
| Symbol | Meaning |
|---|---|
| η(electrolyser) | 33.3 ÷ SEC, on an LHV basis |
| η(storage) | Compression, boil-off, cushion and other losses |
| η(conversion) | Fuel cell, turbine or engine efficiency |
9.3Hydrogen in gas turbines
What changes
4- Faster, hotter flame — risk of flashback
- Higher NOx without new burners
- Fuel skid, valves and sensors for hydrogen
- Larger fuel volume per MW
Where it stands
4- Many turbines accept 30–50 % H₂ by volume
- Several OEMs offer 100 % H₂ on smaller frames
- Hydrogen-ready new plants are being ordered
- Retrofits of existing units are possible
Using the heat as well
- Electrolyser heat for buildings
- Fuel cell CHP
- Turbine exhaust steam
- Oxygen sale
- Absorption cooling
Efficiencies are typical published ranges at rated load; part-load efficiency of turbines is lower. Hydrogen capability depends on the exact turbine model and must be confirmed with the OEM.
Section 10
Plant Types and Configurations
Chemical storage is not one product. The same building blocks are put together in different ways depending on whether the aim is firm power, seasonal balancing, industrial supply or export.
10.1Common configurations
01
SeasonalPower-to-power (P2P)
Electrolyser + compressed or cavern store + fuel cell or turbine. Firms up renewables over days to seasons.
02
Critical sitesHydrogen backup
Stored hydrogen cylinders or hydrides + fuel cells for telecom towers, data centres and hospitals in place of diesel.
03
Off-gridIsland / microgrid
Solar + battery for daily cycling + hydrogen for multi-day cloudy or monsoon periods.
04
ExportPower-to-ammonia hub
Large renewables + electrolysers + ammonia plant and tank farm, near a port for export or fertiliser.
05
Gas gridPower-to-gas
Hydrogen blended into the gas grid, or methanated to synthetic methane and stored in the grid.
06
FeedstockIndustrial buffer
Electrolyser + storage feeding a refinery, steel (DRI) or chemical plant that needs steady hydrogen while power varies.
10.2Choosing a storage form
| Need | Usual choice | Why |
|---|---|---|
| Hours to a day, small site | Compressed H₂ vessels | Simple, quick to build |
| Days to weeks, large site | Many vessel banks or lined rock cavern | Scales without geology |
| Seasonal, hundreds of tonnes | Salt cavern (if available) or ammonia | Lowest cost per tonne |
| Export over oceans | Ammonia or methanol | Existing ships and terminals |
| Near homes and offices | Metal hydrides or LOHC | Low pressure, non-toxic |
10.3Pairing with batteries
- Batteries handle daily cycles and fast grid services
- Hydrogen handles long gaps and seasons
- Together they cut total cost of firm round-the-clock power
- See the Hybrid Storage page for battery-plus-long-duration splits
Section 11
Technical Architecture, Civil and Mechanical Works
A chemical storage plant looks like a small chemical works: process units in a fenced plot, separated by safety distances, with utilities, a control building and an electrical yard.
11.1Main process units
Production
4- Electrolyser halls or containers
- Rectifier and transformer bays
- Water treatment plant
- Gas purification and drying
Storage & conversion
4- Compressors (piston, diaphragm, ionic)
- Vessel banks or cavern wellhead
- Ammonia / methanol synthesis loop
- Refrigerated or pressurised tanks
Return & export
4- Fuel cells or turbine island
- Ammonia cracker or reformer
- Loading bays, jetty or pipeline
- Flare and vent stacks
11.2Civil and structural scope
| Item | What it involves |
|---|---|
| Site grading and drainage | Flood level, storm water, oil and chemical separation |
| Foundations | Compressor blocks (vibration), tank ring walls, pipe racks |
| Bunds and dykes | Containment around ammonia and methanol tanks |
| Buildings | Electrolyser hall, control room, MCC, lab, stores |
| Blast and fire walls | Between compressors, vessels and occupied buildings |
| Roads and access | Fire tender routes, heavy-lift access, loading bays |
11.3Mechanical points special to hydrogen
- Hydrogen-compatible steels (low hardness, austenitic stainless)
- Welded joints preferred over threaded fittings
- Pipe design to ASME B31.12
- Compressors with low leakage seals and purge systems
- Vents routed high and away from ignition sources
- Cryogenic piping and vacuum jackets for liquid hydrogen
Layout is driven by safety distances from a quantitative risk assessment and the applicable PESO and fire rules; footprint per MW varies widely with storage form.
Section 12
Power Conversion, Controls and Grid Integration
Electrolysers run on direct current and are among the largest single electrical loads in a grid. Fuel cells produce direct current; turbines produce AC through a generator. The electrical design links these to the renewable plant and the grid.
An energy management system (EMS) decides, minute by minute, when to make hydrogen, when to store it and when to turn it back into power.
12.1Electrical chain
Charging side
4- Grid or renewable connection (33–400 kV)
- Step-down transformers
- Thyristor or IGBT rectifiers
- Harmonic and reactive-power compensation
Discharge side
4- Fuel cell DC/DC and inverters
- Turbine generator and step-up transformer
- Synchronising and protection
- Black-start capability (optional)
Auxiliaries
4- Compressor drives (MV motors, VFDs)
- Cooling and pumping loads
- UPS for safety systems
- Emergency lighting and ventilation
12.2EMS decision loop
- Read solar, wind, grid price and load
- Forecast next hours and days
- Set electrolyser set-point
- Manage storage pressure / level
- Dispatch fuel cell or turbine
- Report to grid operator
12.3Control and safety layers
| Layer | Role |
|---|---|
| Plant DCS / PLC | Runs the process units, interlocks and sequences |
| Safety instrumented system (SIS) | Independent trips on gas leak, overpressure, fire |
| EMS | Optimises energy, storage and dispatch |
| SCADA / RTU | Links to state or regional load despatch centre |
| Gas and fire detection | H₂, NH₃ and flame detectors with alarms |
12.4Grid integration in India
- Connectivity under CERC (Connectivity and General Network Access) Regulations for ISTS projects
- CEA Technical Standards for Connectivity to the Grid
- Green Energy Open Access Rules, 2022 for sourcing renewable power
- ISTS charge waiver for green hydrogen and ammonia plants commissioned by the notified date
- Scheduling and forecasting under state and regional load despatch centres
- Power-quality limits for large rectifier loads
Section 13
Sizing and Design Calculations
First-cut sizing needs only a few numbers: how much power you can spare, for how long, how long you need to store, and how efficiently you turn the fuel back into power. The formulas below show the method; the live estimator does the arithmetic for you.
13.1Live estimator
Enter the electrolyser size (MW), how many hours a day it runs, its specific energy (kWh per kg), how many days of production you want to store and the back-to-power efficiency (%). It returns hydrogen made per day (kg), the stored mass (tonnes), the stored energy on an LHV basis (MWh at 33.3 kWh/kg), the electricity you get back (MWh) and an estimate of the overall power-to-power efficiency.
Estimate
- Hydrogen per day
- 1,923 kg
- Hydrogen to store
- 13.5 t
- Stored energy (LHV)
- 448 MWh
- Electricity back
- 224 MWh
- Power-to-power efficiency
- ≈ 32 %
Before compression, storage and auxiliary losses (typically a further 5–15 %). Energy uses hydrogen's lower heating value, 33.3 kWh/kg. Preliminary screening only; BARREL confirms any figure with a site study.
13.2Daily hydrogen production
Production
m(day) = P × t ÷ SEC
100 MW × 10 h × 1,000 ÷ 52 kWh/kg ≈ 19,200 kg/day
Running hours come from the solar or wind profile; a solar-only electrolyser often runs 7–9 equivalent hours a day, a solar-wind hybrid 12–18.
| Symbol | Meaning |
|---|---|
| P | Electrolyser power (MW) |
| t | Equivalent full-load hours per day |
| SEC | Specific energy (kWh/kg) |
13.3Stored mass and energy
Store
m(store) = m(day) × days ; E = m × 33.3 kWh/kg
19.2 t/day × 30 days ≈ 576 t ≈ 19,200 MWh (LHV)
This is the hydrogen to be held as working gas. Add the cushion or minimum-pressure inventory on top to size the vessels or cavern.
13.4Electricity back and discharge size
Return
E(back) = E × η(conv) ; P(out) = E(back) ÷ hours of discharge
19,200 MWh × 0.50 = 9,600 MWh; over 20 days × 24 h → 20 MW
The discharge plant can be much smaller than the electrolyser if the store fills over months and empties over weeks.
13.5Ammonia from hydrogen
Carrier
NH₃ (t) = H₂ (t) ÷ 0.178 ; tank V = NH₃ ÷ 0.68 t/m³
576 t H₂ ÷ 0.178 ≈ 3,240 t NH₃ ≈ 4,760 m³ of tank
The same hydrogen held as ammonia fits in a modest refrigerated tank instead of thousands of cubic metres of high-pressure vessels.
13.6Design checks after first sizing
| Check | Why it matters |
|---|---|
| Hourly simulation (8,760 h) | Real renewable profile, not averages |
| Electrolyser turn-down and ramping | Can it follow cloud and wind gusts? |
| Stack degradation and replacement | SEC rises with age; stacks last ≈60,000–90,000 h |
| Compressor duty | Peak flow and number of starts |
| Storage pressure window | Usable vs total inventory |
| Water balance | Source, treatment and reject disposal |
The estimator and worked examples give first-cut figures only. Compression, cushion gas, boil-off and auxiliary loads (typically a further 5–15 %) are not fully included; a feasibility study uses hourly simulation.
Section 14
Engineering Deliverables Register
A chemical storage project is engineered like a process plant. These are the main documents produced from study to handover; the client receives each one for review.
14.1Main deliverables
| Document | Stage | Purpose |
|---|---|---|
| Basis of design | Concept | Agreed inputs: power, duration, purity, site data |
| Energy and mass balance | Concept / FEED | Flows of power, water, hydrogen, oxygen, heat |
| Hourly techno-economic model | Feasibility | Sizing, LCOH / LCOS, sensitivities |
| Process flow diagrams (PFD) | FEED | Main equipment and streams |
| P&IDs | FEED / detailed | Every pipe, valve, instrument and interlock |
| Plot plan and layout | FEED | Equipment positions and safety distances |
| Hazardous-area classification | FEED | Zones for electrical equipment selection |
| HAZID, HAZOP, SIL reports | FEED / detailed | Hazards, safeguards and safety-function ratings |
| Quantitative risk assessment | FEED | Off-site risk and licence application |
| Single-line diagrams | FEED / detailed | Electrical chain from grid to stacks |
| Equipment datasheets and specifications | Detailed | Basis for purchase |
| Civil and structural drawings | Detailed | Foundations, bunds, buildings |
| Commissioning procedures | Construction | Step-by-step start-up and tests |
| O&M manuals and as-built records | Handover | Operating the plant for its life |
14.2Specialist studies often added
- Dispersion and fire modelling
- Noise study
- Water availability study
- Geotechnical survey
- Grid impact study
- Life-cycle carbon assessment
- Environmental impact assessment
The exact list depends on the contract model and the authorities involved; licensing authorities such as PESO set their own drawing and document requirements.
Section 15
Site Selection and Feasibility
The best site has cheap renewable power, water, room for safety distances, and a nearby user or export route. Getting this right does more for cost than any equipment choice.
15.1Site criteria
Energy
4- High solar and wind resource
- Hybrid profile for more running hours
- Grid or ISTS connection nearby
- Banking and open-access rules
Resources
4- Reliable water (or desalination)
- Land for safety distances
- Geology (salt or hard rock) if underground
- Access for heavy equipment
Market
4- Industrial user or power offtaker
- Port for ammonia or methanol export
- Gas grid for blending
- Green hydrogen hub incentives
15.2Feasibility study steps
- 1Define the use: firm power, backup, feedstock or export
- 2Collect hourly solar, wind and load data
- 3Screen sites for land, water, grid and safety distance
- 4Compare storage forms (vessels, cavern, ammonia, methanol)
- 5Size electrolyser, store and back-to-power by hourly simulation
- 6Estimate CAPEX, OPEX, LCOH and LCOS
- 7Check permits, subsidies and offtake options
- 8Recommend the configuration and next steps
15.3India-specific points
- Strong solar in Rajasthan and Gujarat; hybrid sites in Gujarat, Karnataka and Tamil Nadu
- Coastal hubs suit ammonia and methanol export
- Water stress in desert sites — plan treatment and reuse
- Green hydrogen hubs identified under the National Green Hydrogen Mission
Section 16
Turnkey EPC — From Study to Operation
BARREL can deliver chemical storage as one integrated plant — power supply, electrolysers, compression, storage, synthesis and back-to-power — or as separate packages under an owner's engineer.
16.1Project phases
- 1Pre-feasibility and site screening
- 2Feasibility, techno-economics and offtake study
- 3Technology selection and FEED
- 4Approvals and licences (PESO, pollution board, factory, fire, CEA)
- 5Detailed engineering
- 6Procurement of long-lead items (electrolysers, compressors, transformers, tanks)
- 7Civil, mechanical and electrical construction
- 8Pre-commissioning, commissioning and performance tests
- 9Handover, operator training and O&M
16.2Typical work packages
| Package | Contents |
|---|---|
| Electrical | Grid connection, transformers, rectifiers, MV/LV, earthing |
| Electrolyser island | Stacks, balance of plant, purification |
| Compression and storage | Compressors, vessels or cavern surface works |
| Synthesis (if any) | Ammonia or methanol loop, air separation, CO₂ capture |
| Back-to-power | Fuel cells, turbine or engine island |
| Utilities | Water treatment, cooling, nitrogen, instrument air, fire water |
| Civil and buildings | Foundations, bunds, roads, control building |
| Controls and safety | DCS, SIS, EMS, gas and fire detection, SCADA |
16.3Delivery models
01
Full turnkey (LSTK)
One contract, one price, one point of responsibility for performance.
02
EPCM
BARREL engineers and manages; the owner buys equipment directly.
03
Split EPC
Separate supply and installation contracts, often for tax and duty reasons.
04
Build-own-operate
Developer finances and runs the plant and sells hydrogen or power.
Electrolysers and large compressors can have lead times of 12–24 months; early ordering is often the critical path. Lead times are indicative and vary with market conditions.
Section 17
Equipment, Supply Chain and Manufacturing in India
India is building a domestic supply chain for electrolysers and hydrogen equipment, helped by production-linked incentives under the National Green Hydrogen Mission. Some items are made locally today; others are still imported.
17.1Where key items come from
| Equipment | Indian manufacture | Notes |
|---|---|---|
| Alkaline electrolysers | Growing (incentive-backed) | Several Indian factories announced or under way |
| PEM electrolysers | Early | Membranes and catalysts largely imported |
| Transformers and rectifiers | Strong | Mature Indian industry |
| Pressure vessels and tanks | Strong | Built to ASME / IS 2825 codes |
| Hydrogen compressors | Partial | Many high-pressure units imported |
| Fuel cells | Early | Stacks mainly imported; system integration local |
| Ammonia and methanol plants | Strong process know-how | Licensed technology from global licensors |
| Instruments, valves, detectors | Mixed | Hydrogen-rated items often imported |
17.2Support for manufacturing
- SIGHT programme incentives for electrolyser manufacturing
- SIGHT incentives for green hydrogen production
- Approved List of Models and Manufacturers (ALMM) approach under discussion for electrolysers
- Customs duty structure that favours local assembly
17.3Supply-chain risks to manage
Materials
3- Iridium and platinum for PEM
- Nickel for alkaline electrodes
- Carbon fibre for Type IV vessels
Delivery
3- Long lead times for large compressors
- Factory capacity ramp-up
- Warranty and spare-part support in India
The supply picture is changing quickly; status shown is a general indication, not a vendor assessment. BARREL sources equipment through OEM partners selected per project.
Section 18
Testing, Commissioning, Operations and Digital Monitoring
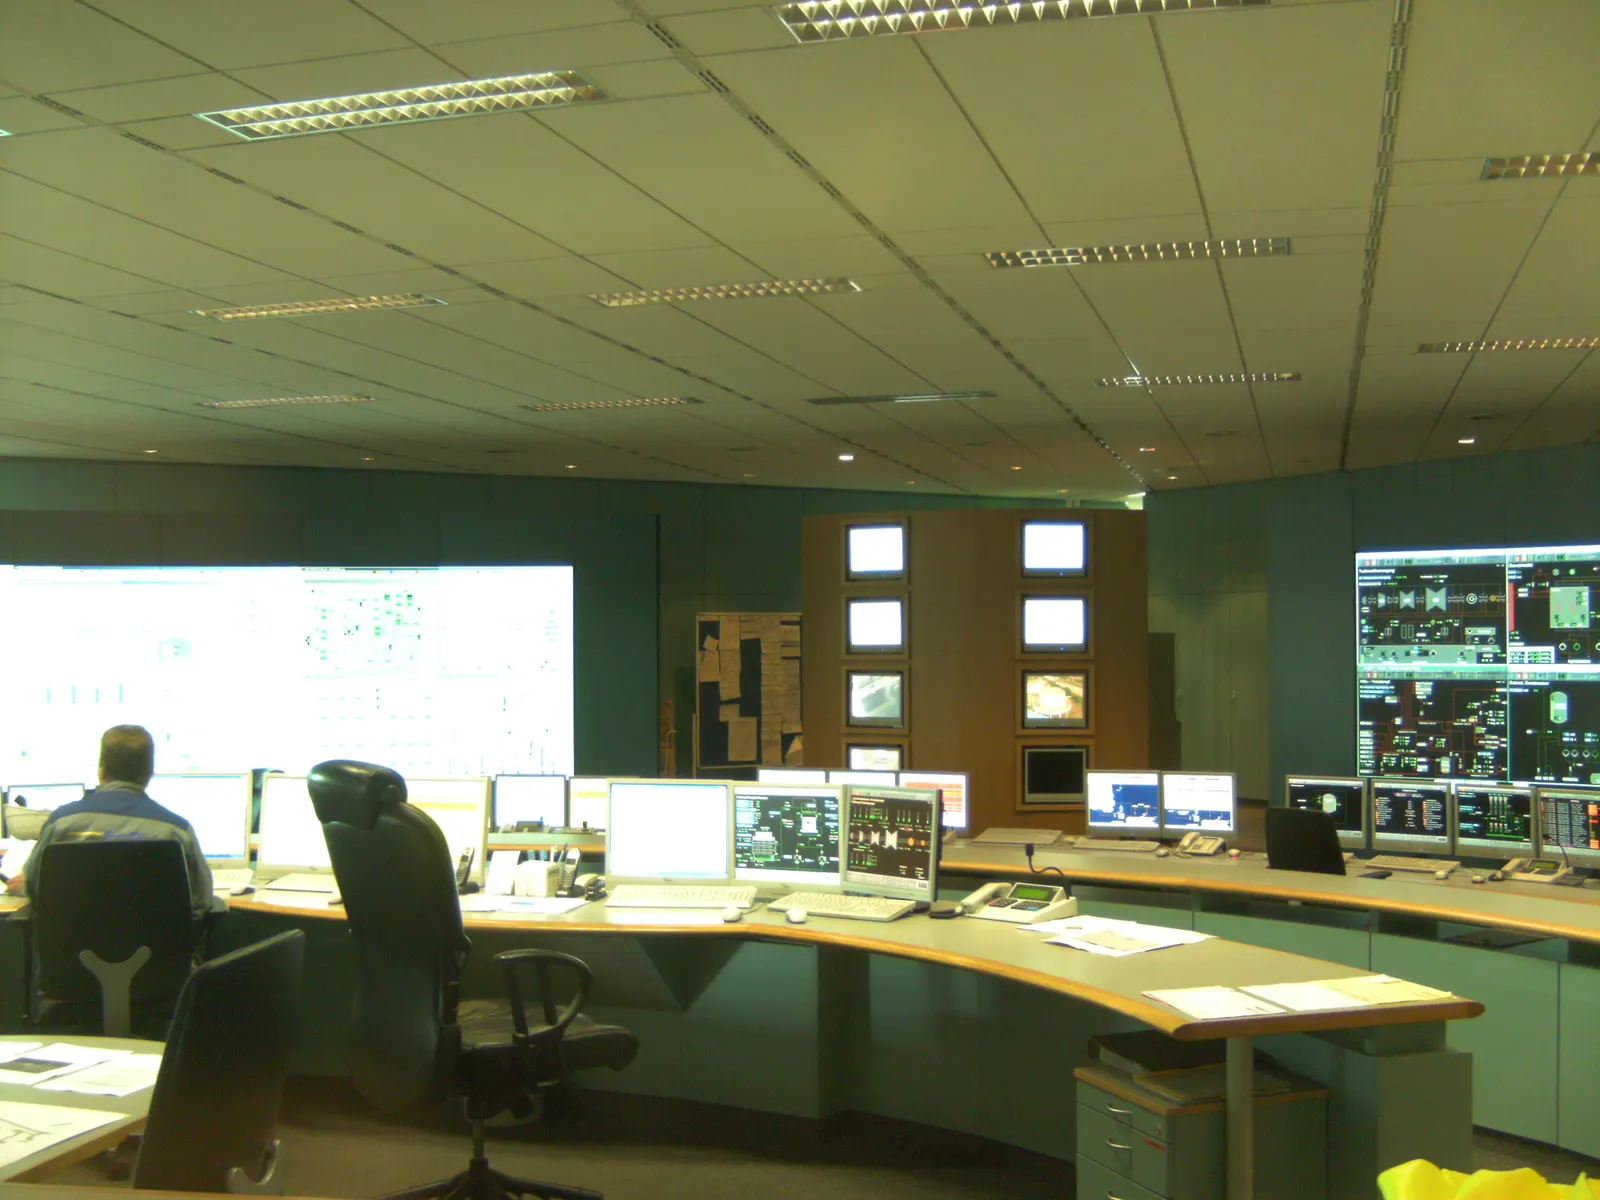
Hydrogen plants are commissioned carefully: every system is cleaned, leak-tested and purged with nitrogen before any hydrogen is introduced.
Running a chemical store then means managing a process plant: safety permits, gas detection, rotating machinery, water quality and electrolyser stacks that wear over time. Good O&M keeps efficiency high and stack life long.
18.1Commissioning sequence
- 1Factory acceptance tests (FAT) of stacks, rectifiers, compressors, control panels
- 2Mechanical completion and punch-list closure
- 3Pressure (hydrostatic or pneumatic) and leak tests
- 4Cleaning, drying and nitrogen purging
- 5Electrical tests: transformers, protection, earthing
- 6Loop checks and SIS function tests
- 7First hydrogen: low-pressure start-up
- 8Stepwise ramp-up to rated load
- 9Performance and reliability tests
18.2Performance tests
| Test | What is proved |
|---|---|
| Specific energy consumption | kWh per kg at rated and part load |
| Hydrogen purity | Meets ISO 14687 grade or process need |
| Ramp rate and turn-down | Follows the renewable profile |
| Storage tightness | Pressure holds over the test period |
| Back-to-power output | Rated MW and efficiency |
| Reliability run | Continuous operation for the agreed period |
18.3Main O&M tasks
Daily
4- Gas-detector and alarm checks
- Water quality (conductivity)
- Pressures and temperatures
- Permit-to-work control
Periodic
4- Compressor valves and seals
- Catalyst and dryer checks
- Vessel inspections
- Calibration of instruments
Long-term
4- Stack refurbishment or replacement
- Fuel cell stack replacement
- Pressure-vessel re-certification
- Turbine hot-gas-path overhauls
18.4Digital and AI tools
01
Remote monitoring
Live dashboards of production, storage level, efficiency and alarms.
02
Digital twin
A model of the plant used to test dispatch plans and predict performance.
03
Predictive maintenance
Machine learning on vibration and stack voltage to plan work before failure.
04
Dispatch optimisation
Forecasts and prices decide when to make, store or sell hydrogen and power.
18.5Key performance indicators
| KPI | What it shows |
|---|---|
| kWh per kg (SEC) | Electrolyser efficiency and stack health |
| Availability (%) | Hours the plant could run |
| Stack voltage trend | Degradation rate |
| Storage losses | Leaks, boil-off, venting |
| Power-to-power efficiency | Overall plant performance |
| Safety events | Near-misses and incidents |
Test durations and acceptance values are set in the contract and the OEM's guarantees. Stack life of roughly 60,000–90,000 operating hours is typical in OEM literature; actual life depends on cycling, water quality and operating temperature.
Section 19
Safety, Risk, Environment and Circularity
Hydrogen, ammonia and methanol are handled safely in industry every day. Each has its own hazard, and the plant is designed around it from the first drawing.
The environmental case matters as much: chemical storage is only as clean as the electricity and carbon that go into it, so it is checked with a life-cycle assessment, not assumed.
19.1Hazards by carrier
| Carrier | Main hazard | Key properties | Main safeguards |
|---|---|---|---|
| Hydrogen | Fire and explosion | Flammable 4–75 % in air; very low ignition energy; near-invisible flame; rises fast | Ventilation, leak and flame detection, zoning, vents high |
| Ammonia | Toxicity | Pungent; harmful at low concentration; flammable only 15–28 % | Leak detection, water curtains, shelters, emergency plan |
| Methanol | Toxicity and fire | Flash point ≈11 °C; poisonous if swallowed; pale flame | Bunding, foam systems, closed handling |
| Liquid hydrogen | Cold burns, pressure | −253 °C; can condense air on pipes | Vacuum jackets, relief valves, cold-resistant materials |
19.2Safety studies and systems
Studies
6- HAZID and HAZOP
- SIL determination and verification
- Quantitative risk assessment (QRA)
- Hazardous-area classification
- Fire and explosion modelling
- Emergency response plan
Systems
6- Safety instrumented system (SIS)
- Gas detection (H₂, NH₃) and flame detection
- Emergency shutdown and blowdown
- Fire water, deluge and foam
- Blast walls and safe separation distances
- Materials tested for hydrogen embrittlement
19.3Project risks besides safety
- Electrolyser performance below guarantee
- Faster stack degradation under cycling
- Delays in licences and approvals
- Offtaker or tariff risk
Flammability limits and properties are standard published values (ISO/TR 15916 and safety data sheets). Site-specific risk is established only by the project's own QRA.
19.4Impacts to manage
Carbon
3- Grid electricity can make hydrogen dirtier than fossil hydrogen
- Green standard: ≤2 kg CO₂e/kg H₂ in India
- CO₂ source rules for e-fuels
Water
3- Freshwater use in dry areas
- Brine from treatment or cavern leaching
- Cooling water discharge
Air
3- Hydrogen leaks have an indirect warming effect
- NOx from ammonia and hydrogen combustion
- Ammonia slip control
19.5Circular practices
- Recover and recycle platinum, iridium and nickel from stacks
- Refurbish electrolyser stacks instead of replacing whole units
- Reuse waste heat and sell oxygen
- Treated wastewater or desalinated water instead of fresh water
- Steel vessels and tanks are recyclable at end of life
- Biogenic CO₂ for e-methanol closes the carbon loop
Life-cycle results depend on the power mix, equipment manufacturing and transport; ISO 14040/14044 and ISO 19870 give the accounting methods.
Section 20
Standards, Codes and Approvals
Chemical storage draws on hydrogen, gas, chemical and electrical codes. In India, licensing for gas and pressure-vessel storage sits mainly with PESO, alongside state pollution, factory and fire authorities.
20.1International standards
| Standard | Covers |
|---|---|
| ISO 22734 | Hydrogen generators using water electrolysis |
| ISO/TR 15916 | Basic considerations for hydrogen safety |
| ISO 14687 | Hydrogen fuel quality |
| ISO 19880 series | Hydrogen fuelling stations |
| ISO 16111 | Transportable metal hydride storage |
| ISO 11114-4 | Steel compatibility with hydrogen (embrittlement tests) |
| ISO 19870 | Greenhouse-gas accounting for hydrogen production |
| IEC 62282 series | Fuel cell technologies |
| IEC 60079 series | Equipment for explosive atmospheres |
| IEC 61508 / 61511 | Functional safety and safety instrumented systems |
| ASME B31.12 | Hydrogen piping and pipelines |
| ASME BPVC Section VIII | Pressure vessels |
| NFPA 2 / NFPA 55 | Hydrogen technologies code; compressed and cryogenic gases |
20.2India — rules and approvals
| Rule / authority | Applies to |
|---|---|
| PESO — Gas Cylinders Rules, 2016 | Hydrogen cylinders and cascades |
| PESO — Static and Mobile Pressure Vessels (Unfired) Rules, 2016 | Bulk hydrogen and ammonia vessels |
| MSIHC Rules, 1989 (Environment Protection Act) | Hazardous chemicals such as ammonia and methanol above threshold quantities |
| Factories Act and state factory rules | Process plant licensing and worker safety |
| State Pollution Control Board | Consent to establish and to operate |
| CEA safety and connectivity regulations | Electrical installations and grid connection |
| IS 2825 | Indian code for unfired pressure vessels |
| MNRE Green Hydrogen Standard (2023) | Definition of green hydrogen: ≤2 kg CO₂e per kg H₂ |
Edition years and the exact list change; the project's code list is fixed in the basis of design and checked against the current versions from ISO, IEC, BIS and PESO at that time.
Section 21
Commercial Models, Costs, Revenue and Investment
Chemical storage is capital-heavy and its economics hinge on cheap electricity, high running hours and a reliable buyer. Its advantage is cheap storage of energy: once the electrolyser and conversion plant are paid for, adding days of storage costs little.
21.1Indicative cost ranges
| Item | Indicative range | Notes |
|---|---|---|
| Electrolyser system, installed | ≈US$1,000–2,500 per kW | Lower for Chinese alkaline; higher for small PEM |
| Compressed-gas storage | ≈US$500–1,500 per kg of H₂ capacity | Depends on pressure and vessel type |
| Salt cavern storage | Tens of US$ per kg of working gas | Where geology exists; excludes cushion gas |
| Ammonia tank storage | Low per kWh stored | Synthesis plant is the main cost |
| Fuel cell plant | ≈US$1,500–3,000 per kW | Falling with scale |
| Hydrogen-capable gas turbine | ≈US$700–1,200 per kW | Close to natural gas plant cost |
| Green hydrogen in India (LCOH) | ≈US$4–5 per kg today | Mission aims to reduce this substantially |
21.2Levelised cost of hydrogen
LCOH
LCOH = (CAPEX × CRF + fixed O&M) ÷ annual kg + SEC × power price
52 kWh/kg × ₹3/kWh ≈ ₹156/kg from electricity alone
Electricity is usually 60–70 % of the cost of green hydrogen, so cheap power and high running hours matter most.
| Symbol | Meaning |
|---|---|
| CRF | Capital recovery factor (from interest rate and life) |
| SEC | Specific energy (kWh/kg) |
21.3Where the money comes from
01
Firm power tariffs
Round-the-clock and FDRE (firm and dispatchable renewable energy) contracts reward long-duration storage.
02
Hydrogen and derivative sales
Supply to refineries, fertiliser, steel and shipping under long-term offtake.
03
Capacity and backup
Peaking capacity, backup for critical sites, diesel replacement.
04
Grid services
Flexible electrolyser demand and fast fuel-cell response.
05
By-products
Oxygen and heat sales.
06
Incentives
SIGHT incentives, ISTS waiver, carbon credits under the Indian Carbon Market.
21.4Investment risks and mitigations
| Risk | Mitigation |
|---|---|
| Technology performance | OEM guarantees, proven references, performance bonds |
| Offtake / demand | Long-term take-or-pay contracts, government tenders |
| Power cost | Long-term renewable PPAs, captive solar-wind |
| Policy change | Incentives locked at award; diversified buyers |
| Construction delays | Early long-lead orders, experienced EPC |
All costs are indicative ranges from public sources (IEA, IRENA, BloombergNEF summaries) as of 2025–26 and move quickly. Project budgets require a site-specific estimate.
Section 22
India and Global Markets and Policy
India aims to be a major producer and exporter of green hydrogen and its derivatives. Long-duration and firm-power tenders are also creating a home market for storing renewable energy.
22.1India's policy framework
| Measure | What it does |
|---|---|
| National Green Hydrogen Mission (Jan 2023) | Target of 5 million tonnes a year of green hydrogen by 2030; outlay of ₹19,744 crore |
| SIGHT programme | Incentives for electrolyser manufacturing and green hydrogen / ammonia production |
| Green Hydrogen Standard (2023) | Defines green hydrogen at ≤2 kg CO₂e per kg H₂ |
| ISTS charge waiver | Waiver of inter-state transmission charges for eligible green hydrogen plants |
| Green Energy Open Access Rules, 2022 | Easier access to renewable power for large users |
| SECI tenders | Green hydrogen and green ammonia procurement, FDRE and RTC power tenders |
| Energy storage VGF scheme | Viability gap funding for battery storage; supports firm renewable supply |
22.2Global picture
Europe
3- RFNBO rules for renewable fuels
- Hydrogen Bank auctions
- Hydrogen import corridors
East Asia
3- Japan contract-for-difference support (2024 act)
- Korea clean hydrogen power auctions
- Ammonia co-firing programmes
Americas & Middle East
3- US hydrogen hubs and tax credits
- Large export projects in the Gulf
- Salt-cavern storage in the US Gulf Coast
22.3What this means for storage
- Export demand drives ammonia and methanol tank and terminal capacity
- FDRE and RTC tenders reward plants that can store energy for days
- Industrial clusters need hydrogen buffers between plants
- Seasonal hydrogen storage becomes useful as renewable share rises
Policy details change; check the current MNRE, Ministry of Power and SECI notifications before relying on any figure. Production targets and markets are covered further on /sectors/green-h2.
Section 23
Frequently Asked Questions and References
Short answers to the questions owners, investors and engineers ask most about storing energy as hydrogen and other chemicals.
23.1Questions and answers
What is chemical energy storage?
Turning electricity into a fuel such as hydrogen, ammonia or methanol, keeping it, and later turning it back into electricity, heat or a product.
How is this page different from the Green Hydrogen hub?
This page is about storing and returning energy. The Green Hydrogen hub at /sectors/green-h2 covers production, offtake, industry use and export in depth.
How efficient is it?
Electricity to hydrogen and back to electricity is typically about 30–40 %. With the waste heat used, the useful total can be 60–80 %.
Why use it if batteries are more efficient?
Batteries are best for hours. For weeks or seasons, the cost of extra battery capacity is too high, while extra hydrogen or ammonia storage is cheap.
How long can hydrogen be stored?
Months or longer in vessels or caverns with very small losses. Liquid hydrogen slowly boils off, so it is used for shorter periods.
How much electricity does it take to make 1 kg of hydrogen?
About 50–55 kWh with today's commercial electrolysers, including auxiliaries.
How much energy is in 1 kg of hydrogen?
33.3 kWh on a lower-heating-value basis, about three times that of 1 kg of petrol, but it takes up much more space.
Is hydrogen dangerous?
It is flammable over a wide range and ignites easily, but it is light and disperses quickly. Industry handles it safely with ventilation, detection and proper codes.
Why convert hydrogen into ammonia?
Ammonia is a liquid at −33 °C or modest pressure, holds more hydrogen per cubic metre than liquid hydrogen and uses existing ships and tanks.
Can ammonia be used directly for power?
Yes — co-fired in coal or gas units, burned in adapted engines and turbines, or used in some solid oxide fuel cells.
Is methanol a good energy store?
Yes for long-term storage and shipping: it is a liquid at room temperature and uses ordinary tanks. It needs a sustainable CO₂ source.
Does India have salt caverns for hydrogen?
Thick salt deposits are limited; studies have looked at Rajasthan. Most Indian projects will use vessels, lined rock caverns or carriers.
How much water does it need?
About 9 kg of pure water per kg of hydrogen by chemistry, and roughly 10–15 litres of raw water after treatment, plus cooling.
Which licences are needed in India?
Typically PESO licences for gas and pressure-vessel storage, State Pollution Control Board consents, factory and fire approvals, and CEA rules for electrical works.
What does green hydrogen cost in India?
Indicatively about US$4–5 per kg today, mainly driven by electricity cost; the National Green Hydrogen Mission aims to bring it down.
Can existing gas turbines burn hydrogen?
Many can burn blends of roughly 30–50 % hydrogen by volume; higher shares need new burners. Check with the OEM for each model.
How long do electrolyser stacks last?
Typically around 60,000–90,000 operating hours before refurbishment, depending on technology and how the plant is run.
What does BARREL do in chemical storage?
BARREL can carry out feasibility, engineering, safety studies, equipment supply through OEM partners, turnkey EPC, O&M and project finance support.
23.2References
- IEA — HydrogenGlobal Hydrogen Review and data
- IRENA — HydrogenGreen hydrogen cost and policy reports
- US DOE — Hydrogen and Fuel Cell Technologies OfficeStorage, safety and cost targets
- NREL — HydrogenResearch on production, storage and fuel cells
- PNNL — Hydrogen ToolsHydrogen safety resources and properties
- MNRE — National Green Hydrogen MissionIndia's mission, standard and schemes
- PESO — Petroleum and Explosives Safety OrganisationLicensing of gas and pressure-vessel storage
- CEA — Central Electricity AuthorityElectrical safety and grid connectivity regulations
- IEC WebstoreIEC 62282, 60079, 61508 and other standards
- Bureau of Indian StandardsIndian standards including IS 2825
Answers give typical figures from public literature and are not project-specific advice.
Section 24
BARREL Services for Chemical Storage
BARREL can take a chemical storage project from first idea to long-term operation, working with OEM partners for electrolysers, compressors, tanks, fuel cells and turbines.
For green hydrogen production, offtake and export, see the Green Hydrogen hub at /sectors/green-h2.
24.1What BARREL offers
01
Feasibility & LCOH / LCOS
Supply, storage and offtake modelled together hour by hour, with levelised cost of hydrogen and of stored energy.
02
Engineering & safety
Process design, FEED, HAZOP, QRA, hazardous-area and storage engineering, back-to-power design.
03
Approvals
Preparation of PESO, pollution board, factory, fire and grid-connection applications.
04
Equipment supply
Electrolysers, compressors, vessels, tanks, fuel cells and turbines through OEM partners.
05
Turnkey EPC
Complete plants from power connection to storage, synthesis and dispatch.
06
O&M & digital
Operation, safety management, maintenance, stack care, monitoring and performance reporting.
07
Hybrid design
Batteries for daily cycling plus hydrogen for long duration, sized together.
08
Finance & offtake
Project structuring, incentive applications and support in finding long-term offtakers.
09
Training
Operator and safety training for hydrogen and ammonia handling.
Project desk
Plan your chemical storage project with BARREL
From electrons to molecules and back.
Hydrogen storage for a renewable park, green ammonia or methanol, or hydrogen back-to-power for a critical site — tell us the energy, duration and use, and we will respond with the options and next steps.
Project categories
- Hydrogen storage
- Green ammonia
- e-Methanol
- Synthetic fuels
- Hydrogen-to-power
- Seasonal storage
- LOHC / hydrides